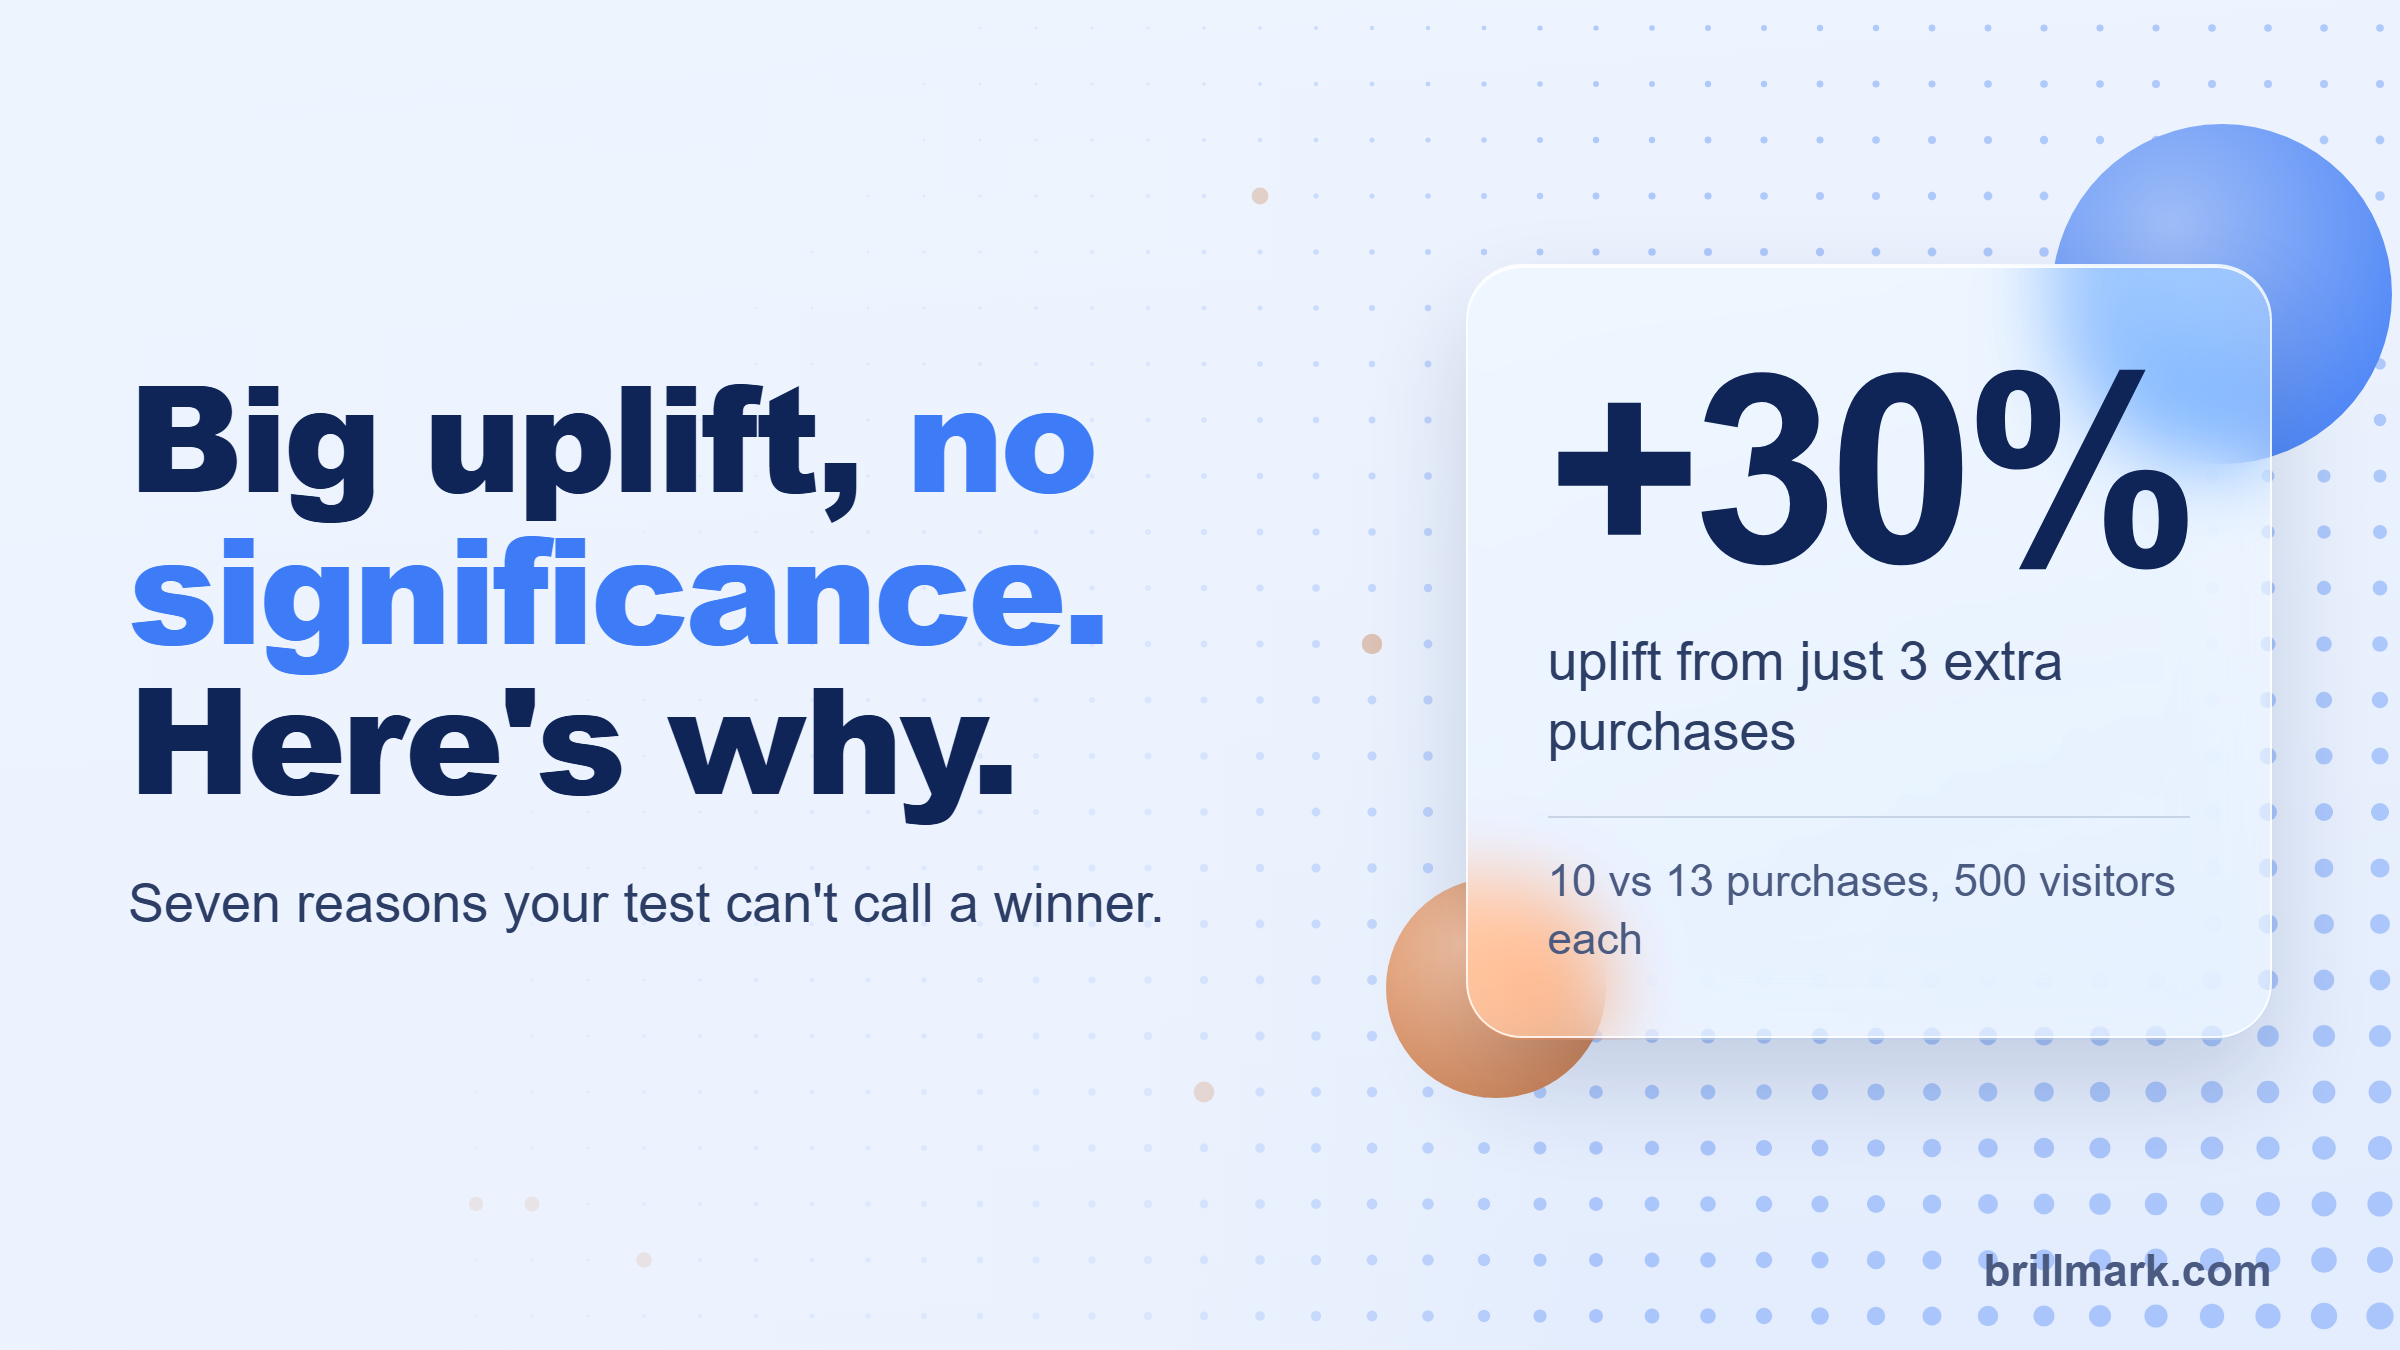
Your A/B testing dashboard shows a 30% uplift in conversion rate. The variation looks like a clear winner. But the confidence level is low, and the test still has not reached statistical significance.
Should you keep it running, launch the variation anyway, or start over? To decide, you need three things the headline percentage hides: how many conversions produced it, how uncertain the estimate is, and whether the test was designed to detect the effect you care about.
Why is my A/B test not statistically significant despite high uplift?
An A/B test can show a high uplift without statistical significance because the estimated improvement is too uncertain. That usually means too few conversions, a small sample, a noisy metric, or a test that was never powered for the effect you are seeing. Tracking errors, uneven assignment and repeated checking can also produce a big number that isn’t real.
Before you act, validate the test, read the range around the result, and decide by the plan you set before launch.
A 30% uplift can come from three extra purchases
Take an illustrative test with 500 visitors in each group:
| Control | Variation | |
|---|---|---|
| Visitors | 500 | 500 |
| Purchases | 10 | 13 |
| Conversion rate | 2.0% | 2.6% |
| Relative uplift | +30% |
The variation converts 30% better in relative terms: (2.6% − 2.0%) / 2.0%. The absolute difference is three purchases.
Run a standard two-sided test on those counts and the p-value is 0.53, nowhere near the usual 0.05 threshold. The 95% confidence interval, the range of effects the data can’t rule out, runs from −63% to +123%.
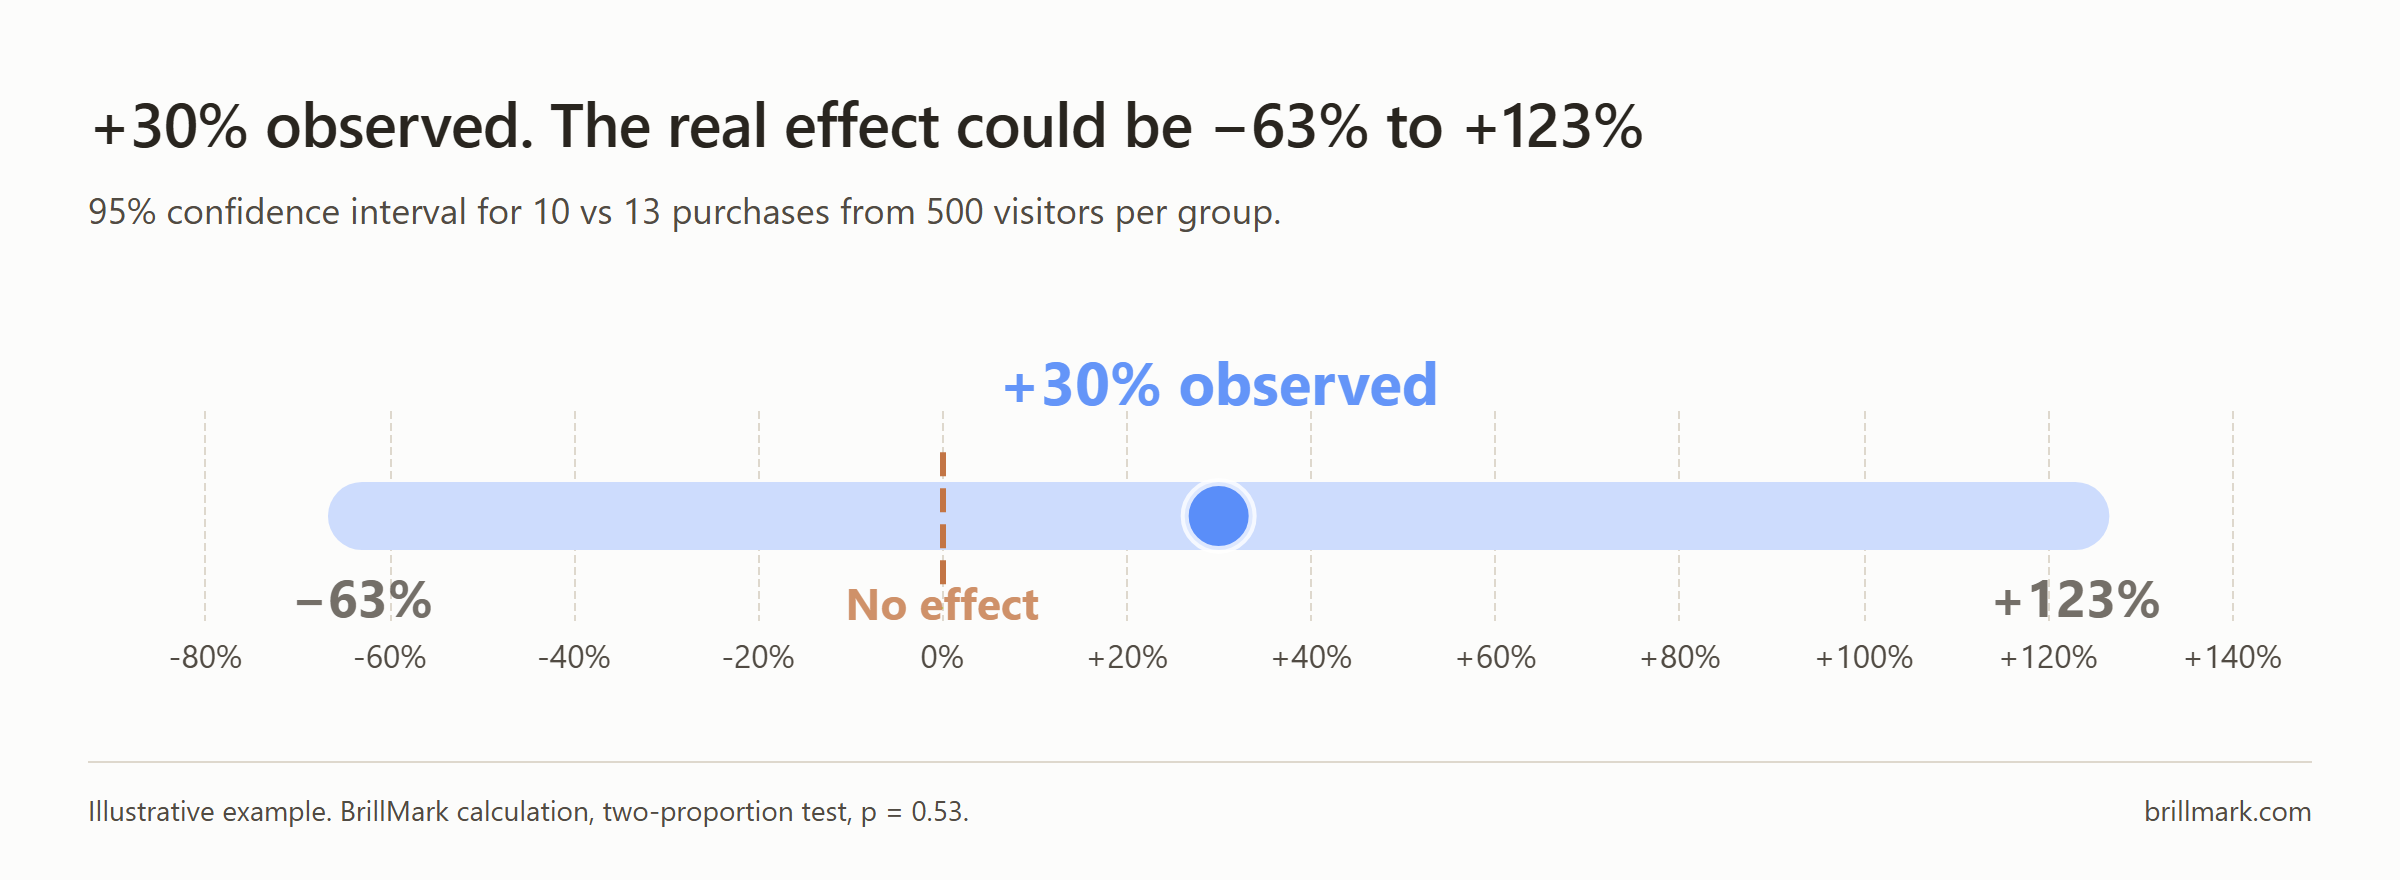
That range includes “the variation is much worse”. The test hasn’t found a winner; it has found that it can’t tell.
Four terms carry the rest of this post:
- Observed uplift: how much better the variation did in your sample.
- Statistical significance: whether the evidence meets a threshold you set before the test.
- Confidence interval: the range of true effects compatible with your data.
- Statistical power: the chance a test detects a real effect of a given size, if one exists.
7 reasons your A/B test shows high uplift but low confidence
1. Too few visitors entered the experiment
With low traffic, a handful of purchases swings the conversion rate. Check the eligible visitors per variation against your pre-test sample-size estimate, counting only visitors who qualify for the test, not total sessions. If the test is within its planned run and still valid, follow the plan. Next time, test on higher-traffic pages.
2. Your baseline conversion rate is very low
At 1% to 2%, visits pile up far faster than orders. Check how many primary-goal conversions you actually have, not just visitors. A higher-volume step such as checkout starts can help you diagnose, but a lift there is not a purchase or revenue win.
3. The test was sized for a bigger effect than you need
Before launch you pick a minimum detectable effect (MDE): the smallest lift worth detecting reliably. Smaller MDEs need far more traffic.
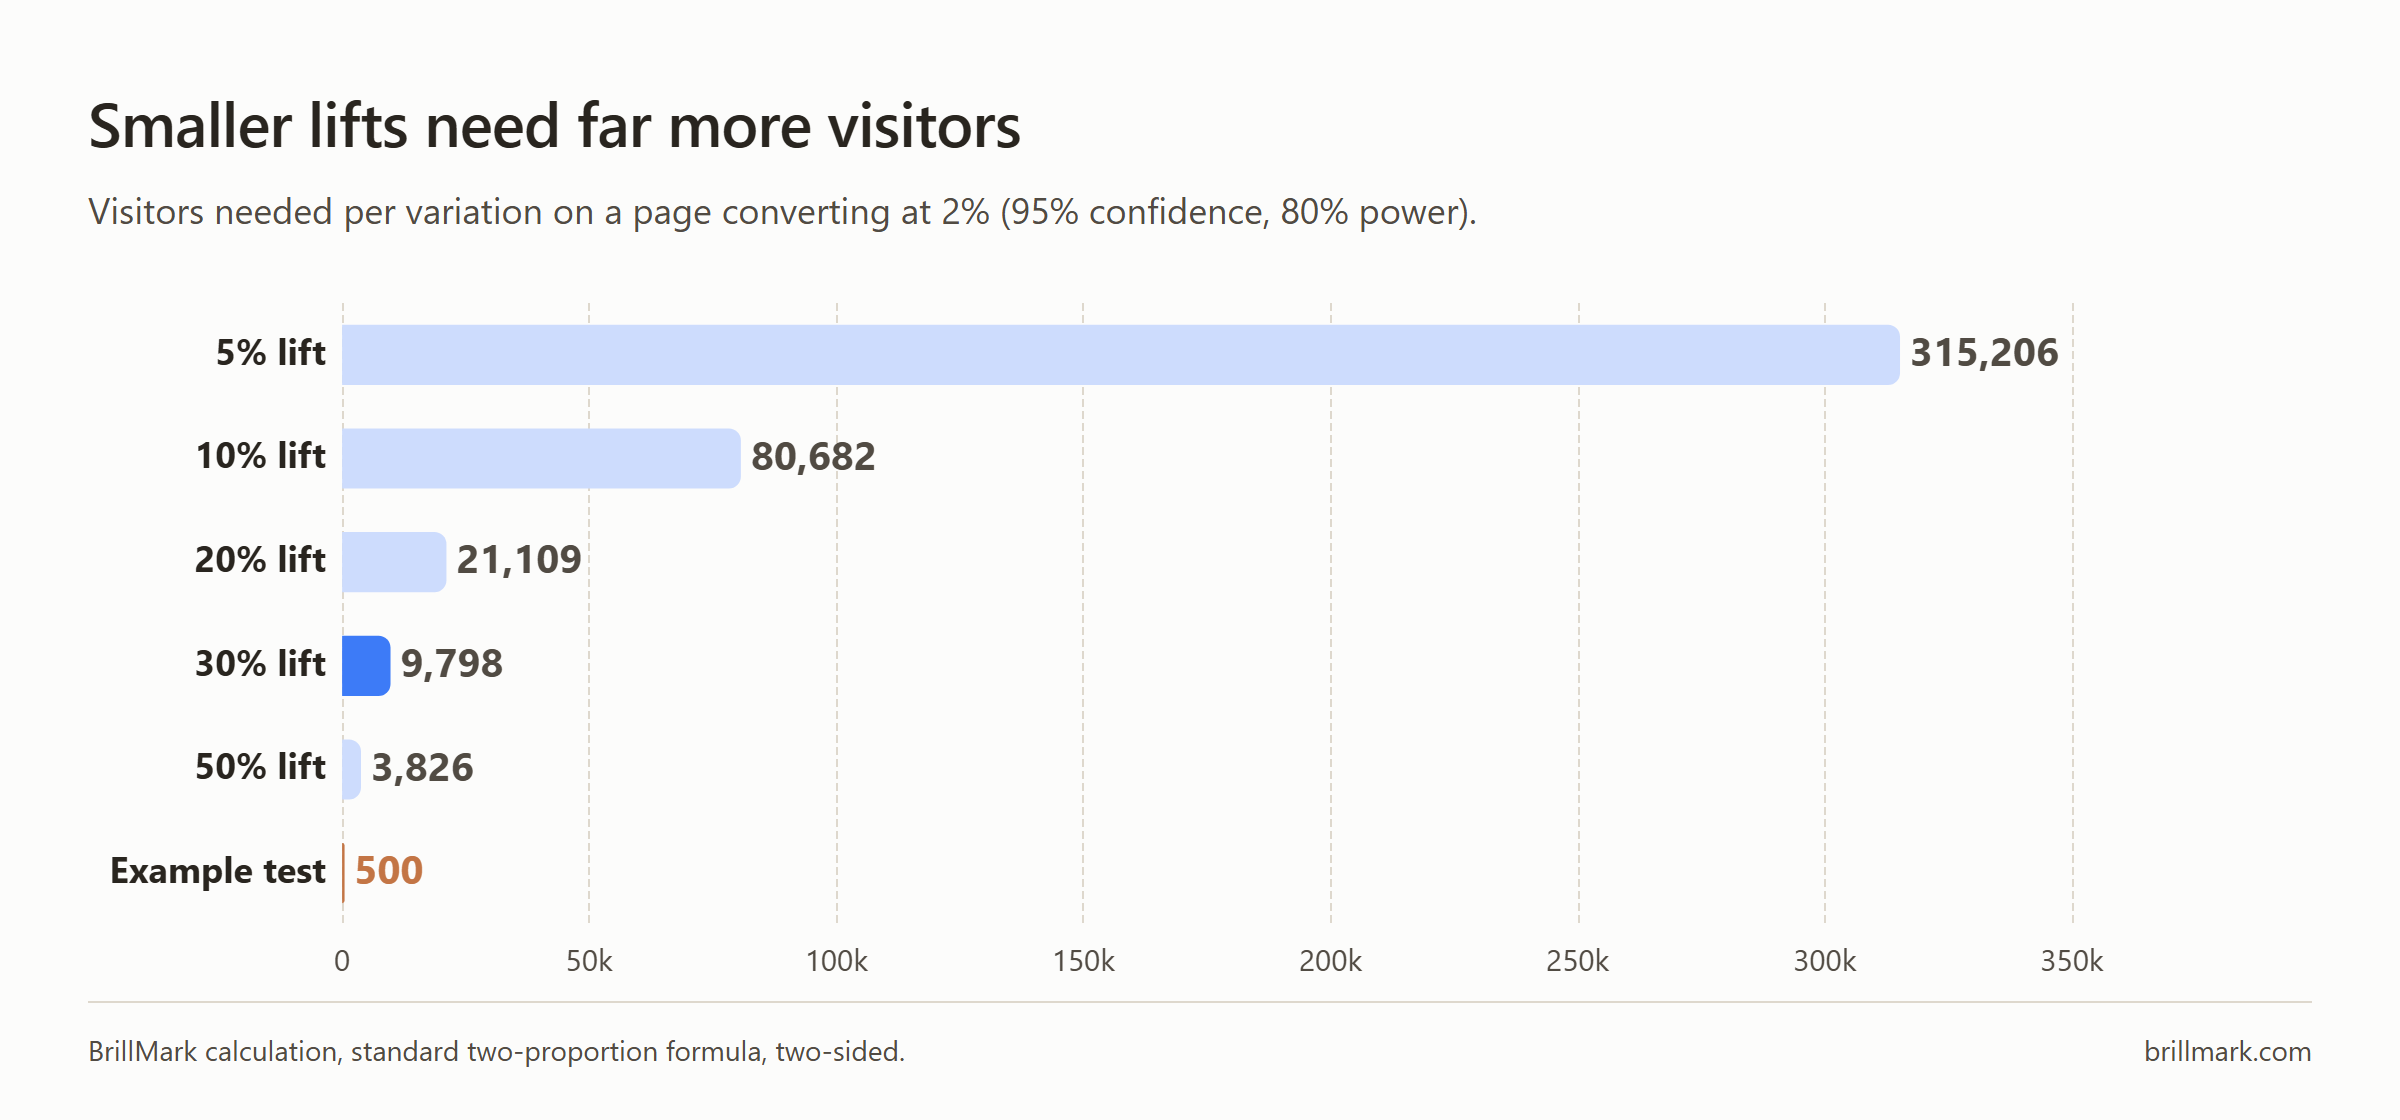
Even detecting the 30% the dashboard shows needs about 9,800 visitors per variation at a 2% baseline, roughly 20 times what the example has. If the plan said 500 visitors, the plan could only ever catch an enormous effect. Decide the MDE from what would justify building the change, and don’t move it after you see results.
4. Results change over time
Weekdays, campaigns, promotions, stock levels and visitor mix all shift conversion behaviour, so an early lift can shrink or flip. Check exposure trends, campaign changes and tracking releases, and make sure the test window covers full business cycles. Don’t stop and restart to catch a favourable stretch.
5. Repeatedly checking significance
Looking at results every morning and stopping the first time confidence crosses 95% inflates false positives in a fixed-horizon test, one analysed once at a planned sample size. Evan Miller’s How Not To Run an A/B Test shows that checking ten times turns what you think is 1% significance into 5%.
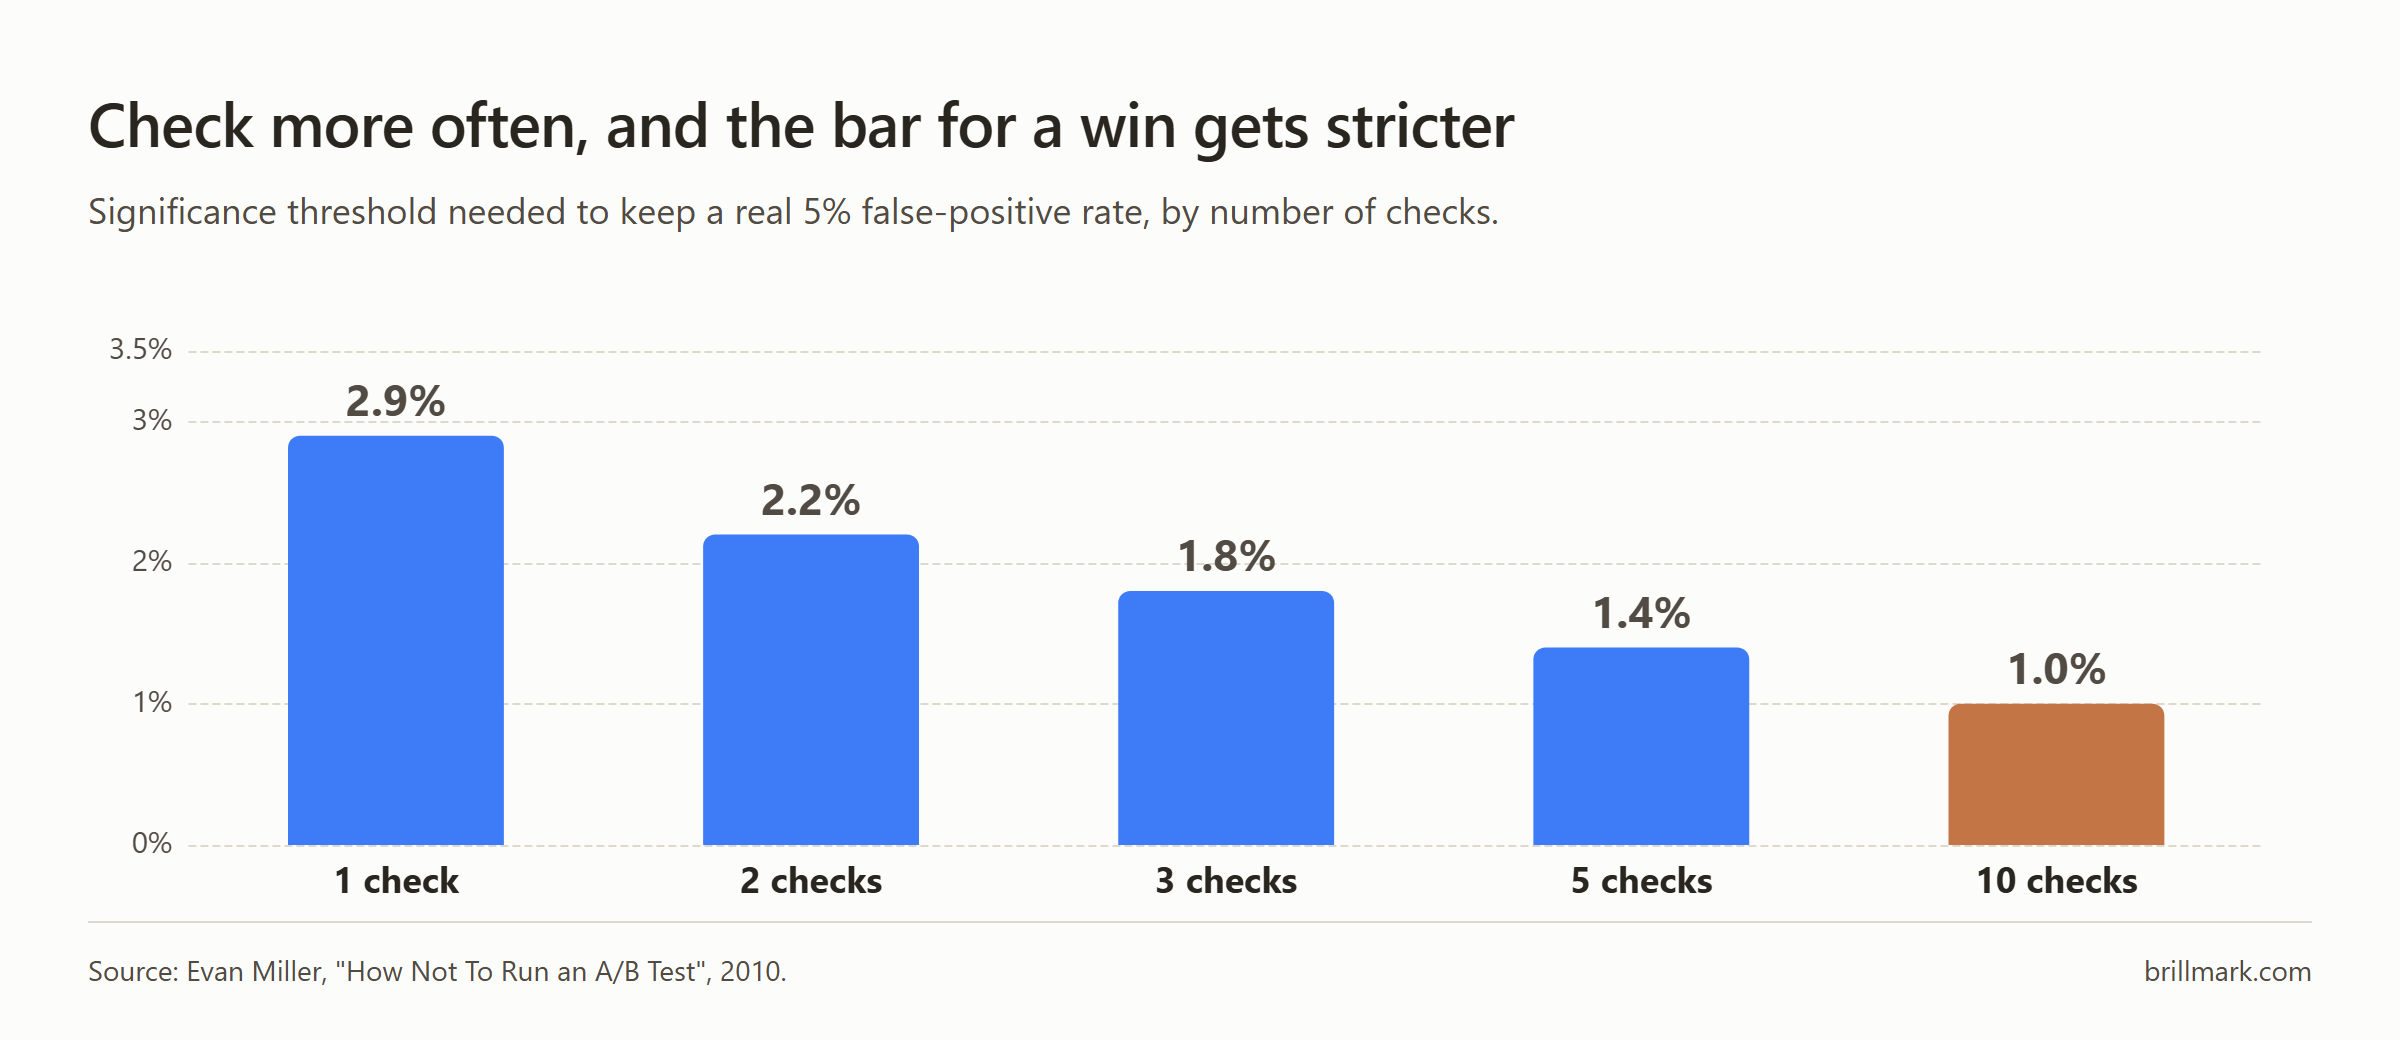
Find out whether your platform uses a fixed-horizon, sequential or Bayesian method, and follow the stopping rule it supports. Checking dashboards for health problems is fine. Declaring a winner the first time the number looks good is not.
6. Tracking or randomization is broken
A big uplift can be a measurement artifact: a purchase event that fires twice in the variation, a control that misses conversions, or one group receiving more eligible traffic than planned. Check that:
- one real conversion fires the event exactly once
- transaction IDs and revenue reconcile with backend orders
- targeting and activation ran as intended
- each user stays in the same version
- there is no sample ratio mismatch (SRM), a traffic split that doesn’t match the one you set
Optimizely describes SRM as often caused “by an implementation issue or third-party bots”: a warning to investigate, not a verdict on the variation. Fix data problems before reading anything. That is why our A/B test builds verify every goal and event before launch: a test with broken tracking can’t give you a result worth arguing about.
7. A noisy metric or small segments
Revenue and average order value swing on a few large orders. Splitting results by device, country and audience shrinks the data behind each number. Check for outlier orders and whether the uplift comes from the whole test or one subgroup. Treat unplanned segment wins as hypotheses for the next test.
How to troubleshoot an inconclusive A/B test
Work through it in this order:
- Check data quality: events, assignment, eligibility, sample ratio.
- Reread the plan: primary metric, MDE, sample size, stopping rule.
- Count the purchases or leads separating the versions, and read the confidence interval.
- Check guardrails: are clicks up while orders fall?
- Decide by the plan.
A wide range and a precise estimate near zero are both “not significant”, but they lead to different decisions.
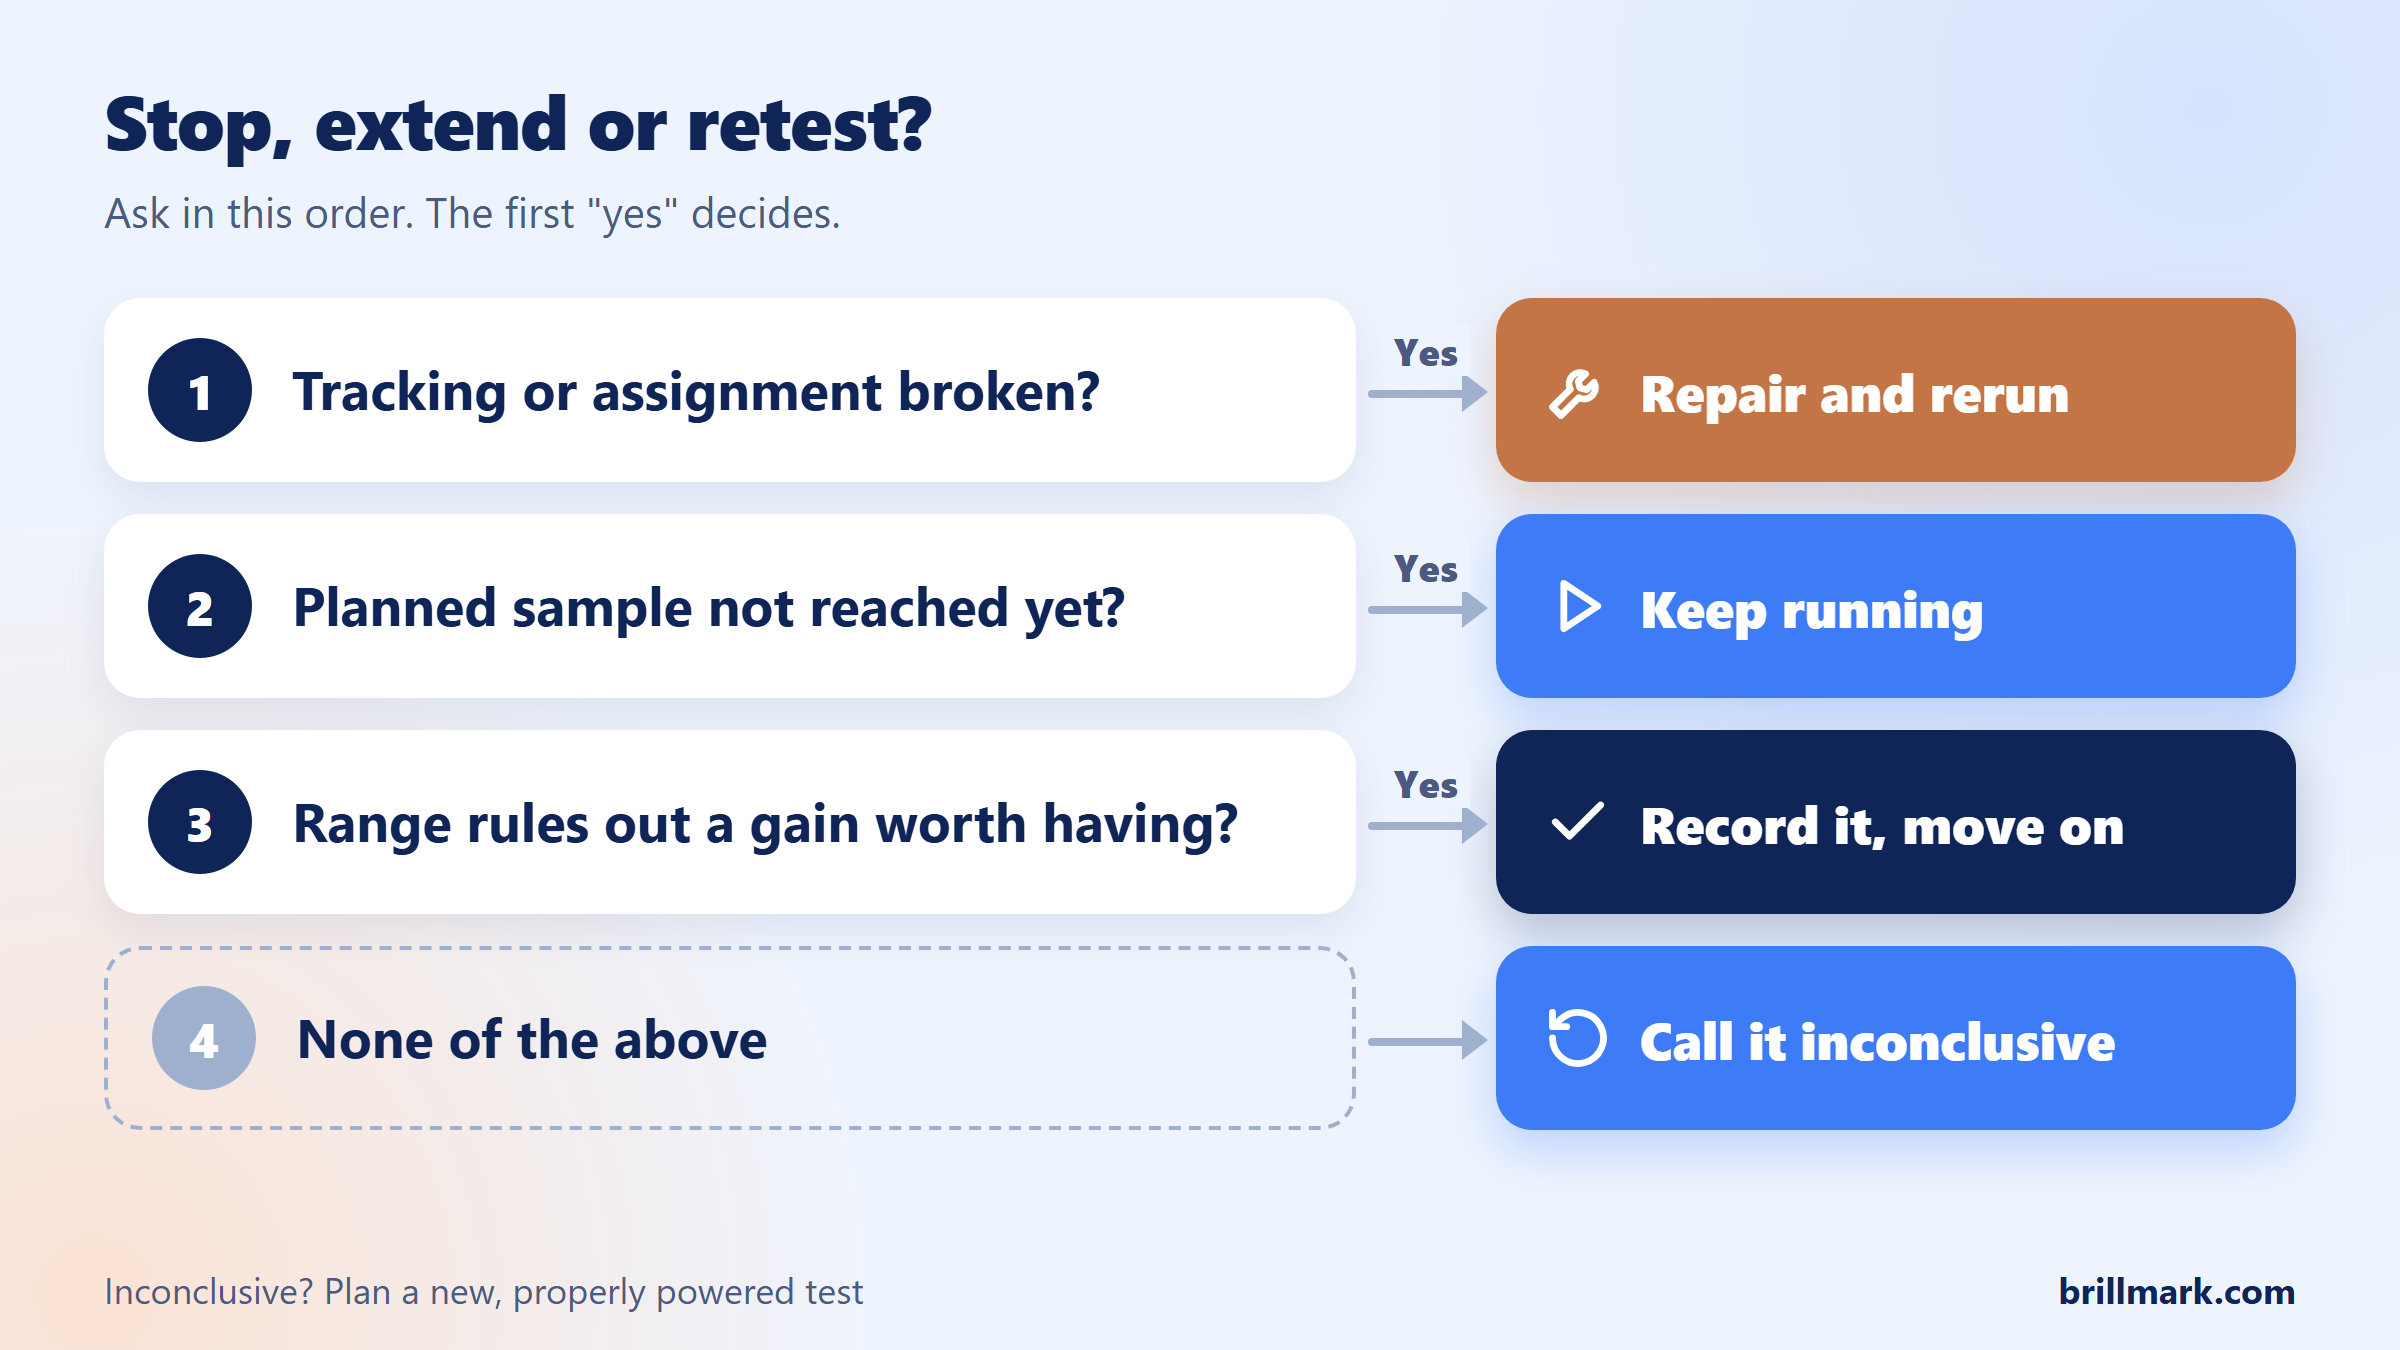
When should you stop, extend or retest?
| Situation | What to do |
|---|---|
| Healthy test, planned duration or sample not reached | Continue as planned |
| Fixed-horizon test ended, result still uncertain | Report inconclusive; design a new, powered test |
| Interval rules out a commercially meaningful gain | Record the learning and move on |
| Tracking or assignment has material errors | Repair and rerun; don’t trust the result |
| Primary metric flat, a click metric up | Diagnose the funnel; not a business win |
| A small segment wins after many cuts | Treat as exploratory; confirm in a new test |
An extension is not automatically valid. In a fixed-horizon test, adding visitors after seeing a disappointing p-value changes the analysis. Either use a method built for sequential monitoring or treat the follow-up as a new experiment.
How to plan the next test so it can reach a conclusion
- One primary metric that drives the decision, plus guardrails.
- Sample size estimated before launch from baseline rate, MDE, power and significance level, using eligible traffic only. Adobe Target’s guide shows how these trade off.
- A change aimed at real customer friction, big enough to move the number.
- Assignment and tracking QA’d on every device and variation before full traffic.
- A stopping rule written down before anyone sees data.
FAQ
Can a 30% uplift be statistically insignificant?
Yes. 13 purchases against 10, from 500 visitors each, is a 30% uplift with a p-value of 0.53.
Is 90% confidence enough to declare a winner?
There is no universal threshold. Use the rule you set before the test; changing it after seeing results undermines it.
Why did my test reach significance and then lose it?
The estimate moves as data arrives, and repeated checks of a fixed-horizon p-value make temporary crossings easy to misread.
Should I launch a variation with high uplift but low confidence?
Not on the uplift alone. Weigh the plausible downside and how reversible the change is: a copy tweak and a checkout rebuild deserve different bars.
High uplift is an estimate; significance is about the evidence behind it. A trustworthy inconclusive result is more useful than a misleading win.
Tests keep showing big lifts you can’t trust? BrillMark builds, QAs and launches A/B tests with goals and tracking verified before launch. Send us your next test and get a scope, hour estimate and QA plan, usually within one business day.
Make your website ready for the AI era.
AI is changing how people discover, evaluate, and interact with websites. We help you identify optimization opportunities across content, UX, technical performance, SEO, and conversion paths.