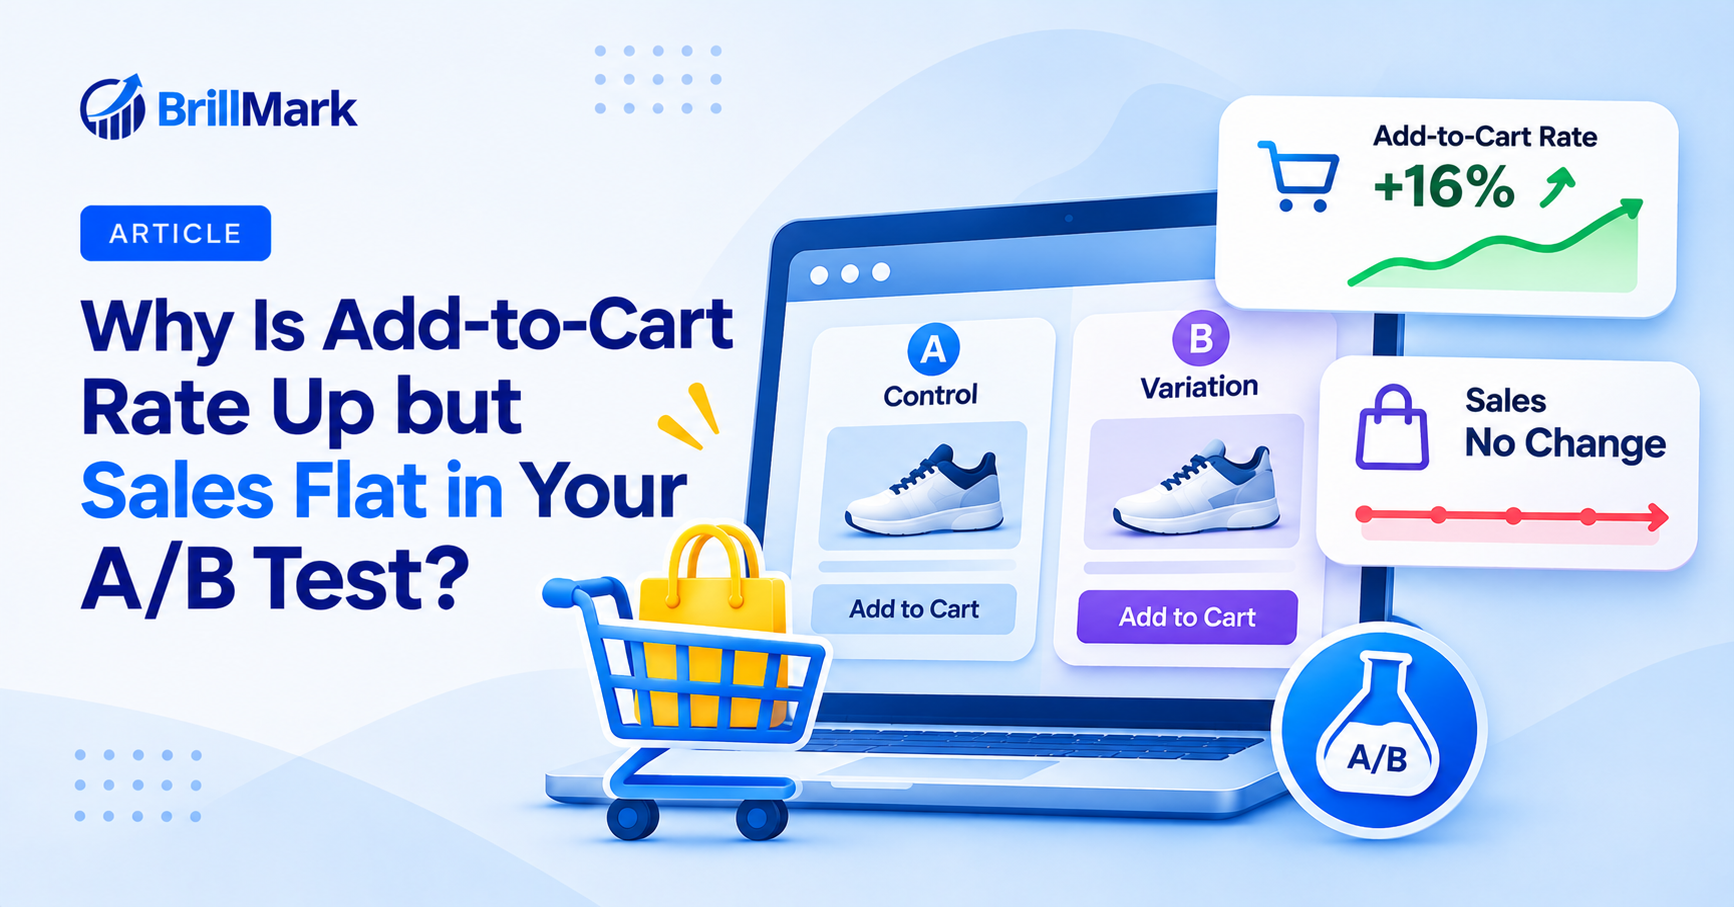
An A/B test shows a 15% increase in add-to-cart rate. The team celebrates. Then someone checks the revenue report: purchases have barely moved.
Did the test work, or did it only make a button easier to click?
This is one of the most frustrating outcomes in ecommerce experimentation. A variation can improve an early shopping action without generating more orders. The difference matters because the objective of most ecommerce stores is not simply to build fuller carts; it is to generate profitable purchases.
Quick Answer: Why Can Add-to-Cart Increase Without More Sales?
An A/B test can raise add-to-cart rate while sales stay flat because adding an item to the cart is not the same as completing an order. Shoppers may abandon at shipping, payment, or checkout; the variation may attract low-intent cart additions; the purchase sample may be too small; or the tracking may be counting cart actions incorrectly.
To diagnose the result, verify tracking first, then compare each funnel step and revenue per visitor between control and variation. Do not launch a variation based on a higher add-to-cart rate alone if purchases are the true business goal.
First, Check Whether You Are Comparing the Same Metrics
Before investigating the user experience, confirm what the dashboard actually counts.
- Add-to-cart events: Total times products were added, including repeat additions by the same shopper.
- Add-to-cart user rate: Percentage of eligible users who added at least one item. This is not the same as event count.
- Purchase conversion rate: Percentage of eligible users who completed at least one purchase.
- Revenue per visitor (RPV): Total attributed revenue divided by eligible visitors.
Google Analytics defines add_to_cart and purchase as separate ecommerce events; its “Add to carts” metric counts add-to-cart event occurrences, not unique purchasers. See Google’s recommended ecommerce events and ecommerce metrics definitions.
Always use a consistent experiment population, attribution window, and unit of analysis. If the A/B testing platform reports unique converting visitors while GA4 reports event totals, the figures are not directly comparable.
An Example: More Carts, the Same Number of Orders
Consider this illustrative example, not a real client result:
| Metric | Control | Variation |
| Visitors | 10,000 | 10,000 |
| Visitors who added to cart | 800 | 920 |
| Add-to-cart user rate | 8.0% | 9.2% |
| Visitors who purchased | 250 | 250 |
| Purchase conversion rate | 2.5% | 2.5% |
| Revenue | $20,000 | $20,000 |
| Revenue per visitor | $2.00 | $2.00 |
The variation delivers a 15% relative lift in add-to-cart user rate but no observed lift in orders or RPV. This does not automatically prove the change had zero purchase impact: uncertainty around the purchase estimate still needs to be evaluated. It does show why the add-to-cart metric alone is insufficient for a rollout decision.
7 Reasons Add-to-Cart Improves While Purchases Don’t
1. The Variation Makes Adding Easy, Not Buying Easier
A sticky add-to-cart button, prominent CTA, or quick-add control can make the first action simpler. But if shipping, account creation, or payment remain difficult, more shoppers may reach the cart and then leave.
Check: Compare checkout-start rate and purchase rate for all assigned visitors. Inspect the cart and checkout experience on mobile, not just the product page.
2. Unexpected Costs Appear After the Cart
Delivery fees, taxes, minimum order requirements, or unclear returns may become visible only after an item is added. The A/B variation may increase curiosity-driven cart additions without changing shoppers’ willingness to pay the final amount.
Check: Review the point at which shipping and other costs appear. Use abandonment surveys or support questions to validate the reason rather than assuming it.
3. The New CTA Attracts Lower-Intent Clicks
A larger button or more persuasive message can generate additional actions from visitors who are not ready to buy. Some may be using the cart as a wishlist or a way to estimate total costs.
Check: Review remove-from-cart events, cart visits, checkout starts, and purchasing behavior. Segment exploration can suggest hypotheses, but avoid declaring a subgroup winner based on unplanned slicing.
4. An Inventory or Variant Issue Blocks Checkout
Shoppers might add a product before discovering the preferred size is unavailable, inventory changed, or a bundle option is incompatible with checkout.
Check: QA every supported variant, stock state, discount, bundle, and quick-add path. Verify the actual product and variant IDs that reach the cart.
5. Checkout Friction Is Unchanged—or Worse
The variation may change a drawer, modal, redirect, or quantity selector in ways that interfere with checkout. On mobile, a sticky element can overlap cart controls or payment options.
Check: Test the full purchase journey across major mobile and desktop browsers, including payment errors, coupon entry, redirects, and third-party app interactions.
6. Cart Events Are Duplicated or Purchases Are Missing
An add-to-cart listener might fire twice after rerendering, a single-page application route change, or an A/B test reactivation. Conversely, purchase tracking may fail on the order-confirmation page.
Check: For one actual add action, verify one expected analytics event. Compare purchase counts and transaction IDs with backend orders. Check the A/B platform, data layer, GTM, and GA4 without assuming any one system is correct.
Also check experiment assignment integrity. A sample ratio mismatch can indicate implementation or data-quality issues; see Optimizely’s documentation.
7. Purchase Data Is Too Sparse to Draw a Conclusion
Add-to-cart actions are typically more frequent than purchases. A test may have enough data to detect an add-to-cart effect but not enough to determine whether order conversion changed meaningfully.
Check: Review the original sample-size plan, confidence interval, minimum detectable effect, and test duration. A nonsignificant purchase result is not proof of no purchase effect. Avoid extending a fixed-horizon test repeatedly just to obtain a favorable p-value.
How to Diagnose the Problem: A Step-by-Step Checklist
Follow this order before interpreting the variation as a success or failure.
- Validate experiment health. Confirm expected traffic allocation, stable assignment, actual variation exposure, and correct audience targeting.
- Validate ecommerce tracking. Check view_item, add_to_cart, begin_checkout, and purchase; compare unique users and event counts separately.
- Reconcile completed orders. Match purchase events, transaction IDs, and revenue against the store’s order system for the same eligible population and time window.
- Inspect the whole funnel. Locate the stage where the variation loses its early advantage: cart view, checkout start, shipping, payment, or order completion.
- QA the variation end to end. Test realistic products, variants, discounts, devices, cart states, and payment methods.
- Check business outcomes. Compare purchase conversion, RPV, AOV, and relevant refunds or returns, not only clicks.
- Assess uncertainty and decide. Use the preselected primary metric, guardrails, and planned analysis method before choosing to ship, revise, retest, or keep control.
A Simple Funnel Comparison
| Funnel stage | Diagnostic question |
| Product view → Add to cart | Does the variation make adding a product easier? |
| Add to cart → Checkout start | Are new cart additions less likely to continue? |
| Checkout start → Payment | Do shipping costs, forms, or errors block progress? |
| Payment → Purchase | Are payments failing or purchase events missing? |
| Purchase → Revenue | Did changes in order value offset order growth? |
Treat the step-level rates as diagnostic, not automatically causal: conditioning only on shoppers who added to cart changes which people are included in each group. For a reliable experiment decision, retain all properly assigned eligible visitors in the primary comparison.
Should You Launch a Variation That Improves Add-to-Cart but Not Sales?
Usually, not on that evidence alone. The correct decision depends on what the experiment was designed to improve and what the purchase data can rule out.
| Evidence | Reasonable next step |
| Cart lift is real; purchase impact is still uncertain | Keep control or follow the planned test duration; assess whether a powered follow-up is worthwhile |
| Cart lift is real; meaningful purchase gains are ruled out | Do not present it as a revenue win; investigate downstream friction |
| Purchase conversion is flat but RPV declines | Investigate AOV or product-mix changes; check revenue guardrails before rollout |
| Purchase conversion and RPV improve with acceptable uncertainty | Consider rollout after QA and guardrail checks |
| Tracking or assignment is unreliable | Repair measurement and rerun; avoid interpreting the corrupted result |
Experiment platforms commonly distinguish primary metrics from secondary and guardrail metrics. Statsig’s scorecard guidance recommends defining the primary outcome and monitoring other metrics for negative effects.
If your original hypothesis concerned purchasing, a higher add-to-cart rate is encouraging diagnostic evidence—not a substitute for the purchase result.
What Should You A/B Test Next?
Use the observed drop-off to choose the next experiment rather than running another random button-color test.
- If shoppers abandon after seeing shipping costs: Test clearer shipping-cost information earlier in the purchase journey.
- If mobile checkout abandonment is high: Test a simpler, less obstructed cart-to-checkout flow.
- If shoppers remove items after adding them: Test better sizing, variant, delivery, or product information before the add-to-cart action.
- If purchases are too rare to evaluate: Prioritize a higher-traffic page, larger hypothesis-driven change, or qualitative research before running another underpowered experiment.
These are hypotheses, not guaranteed wins. Define the measurement plan before launching each test.
Frequently Asked Questions
Is higher add-to-cart rate always a positive A/B test result?
It is positive for that specific metric if the lift is reliable. It does not automatically mean the experiment increased purchases, revenue, or profit. Evaluate the metric against the original business objective.
Why does GA4 show more add-to-cart events than my A/B testing platform?
GA4 may count repeat add_to_cart events while the testing platform counts unique users who converted. Differences can also come from tagging, eligibility, consent, attribution windows, or duplicate firing. Verify definitions before comparing totals.
Can an A/B test increase clicks but reduce revenue?
Yes. A change can attract more early-funnel actions while shifting visitors toward lower-priced items, introducing checkout friction, or affecting purchase intent. Revenue per visitor helps detect tradeoffs that click metrics miss.
What if add-to-cart is statistically significant but purchases are not?
You have stronger evidence for an add-to-cart effect than for a purchase effect. The purchase result may be inconclusive because the sample is too small. Inspect its confidence interval and the study design; do not call the variation a purchase winner.
Should add-to-cart or purchase conversion be the primary A/B test metric?
Choose based on the decision the experiment is meant to support. If the business objective is more orders, purchase conversion or revenue per visitor is often the better primary metric. Add-to-cart can still be a useful secondary diagnostic metric.
Final Takeaway
More add-to-cart actions do not necessarily mean more sales. When an ecommerce A/B test improves an early action but not purchases, start with measurement quality, inspect the entire funnel, and compare actual business outcomes before choosing a winner.
The best next experiment is often not another CTA tweak. It is a targeted fix for the point where interested shoppers stop progressing.
At Brillmark, we help ecommerce teams develop conversion hypotheses, implement A/B tests, validate tracking, and QA the full customer journey. If your experiments generate more clicks but not more revenue, talk to our team about finding the bottleneck.
Make your website ready for the AI era.
AI is changing how people discover, evaluate, and interact with websites. We help you identify optimization opportunities across content, UX, technical performance, SEO, and conversion paths.