
In 2012 a Microsoft employee working on Bing suggested a small change to how ad headlines were shown. It would take an engineer a few days to build, so it sat in a backlog of hundreds of ideas for more than six months. When someone finally tested it, revenue went up 12%, which Ron Kohavi and Stefan Thomke put at more than $100 million a year in the US alone (Harvard Business Review, 2017).
Most ideas don’t do that. In the same article, about one in three experiments at Microsoft improved the metric they were built to move. At Google and Bing it was 10% to 20%. So the job of an A/B test is to give you an answer you can trust, whichever way it goes. Below are the parts every test is made of, the types you can choose, how to set up your first one, and the examples worth knowing.
What is an A/B test?
An A/B test splits your visitors at random between the current page (the control, A) and a changed version (the variant, B), then compares one metric you chose before the test started. Because the split is random, the only thing that differs between the two groups is your change. If B converts better by more than chance would explain, the change caused it.
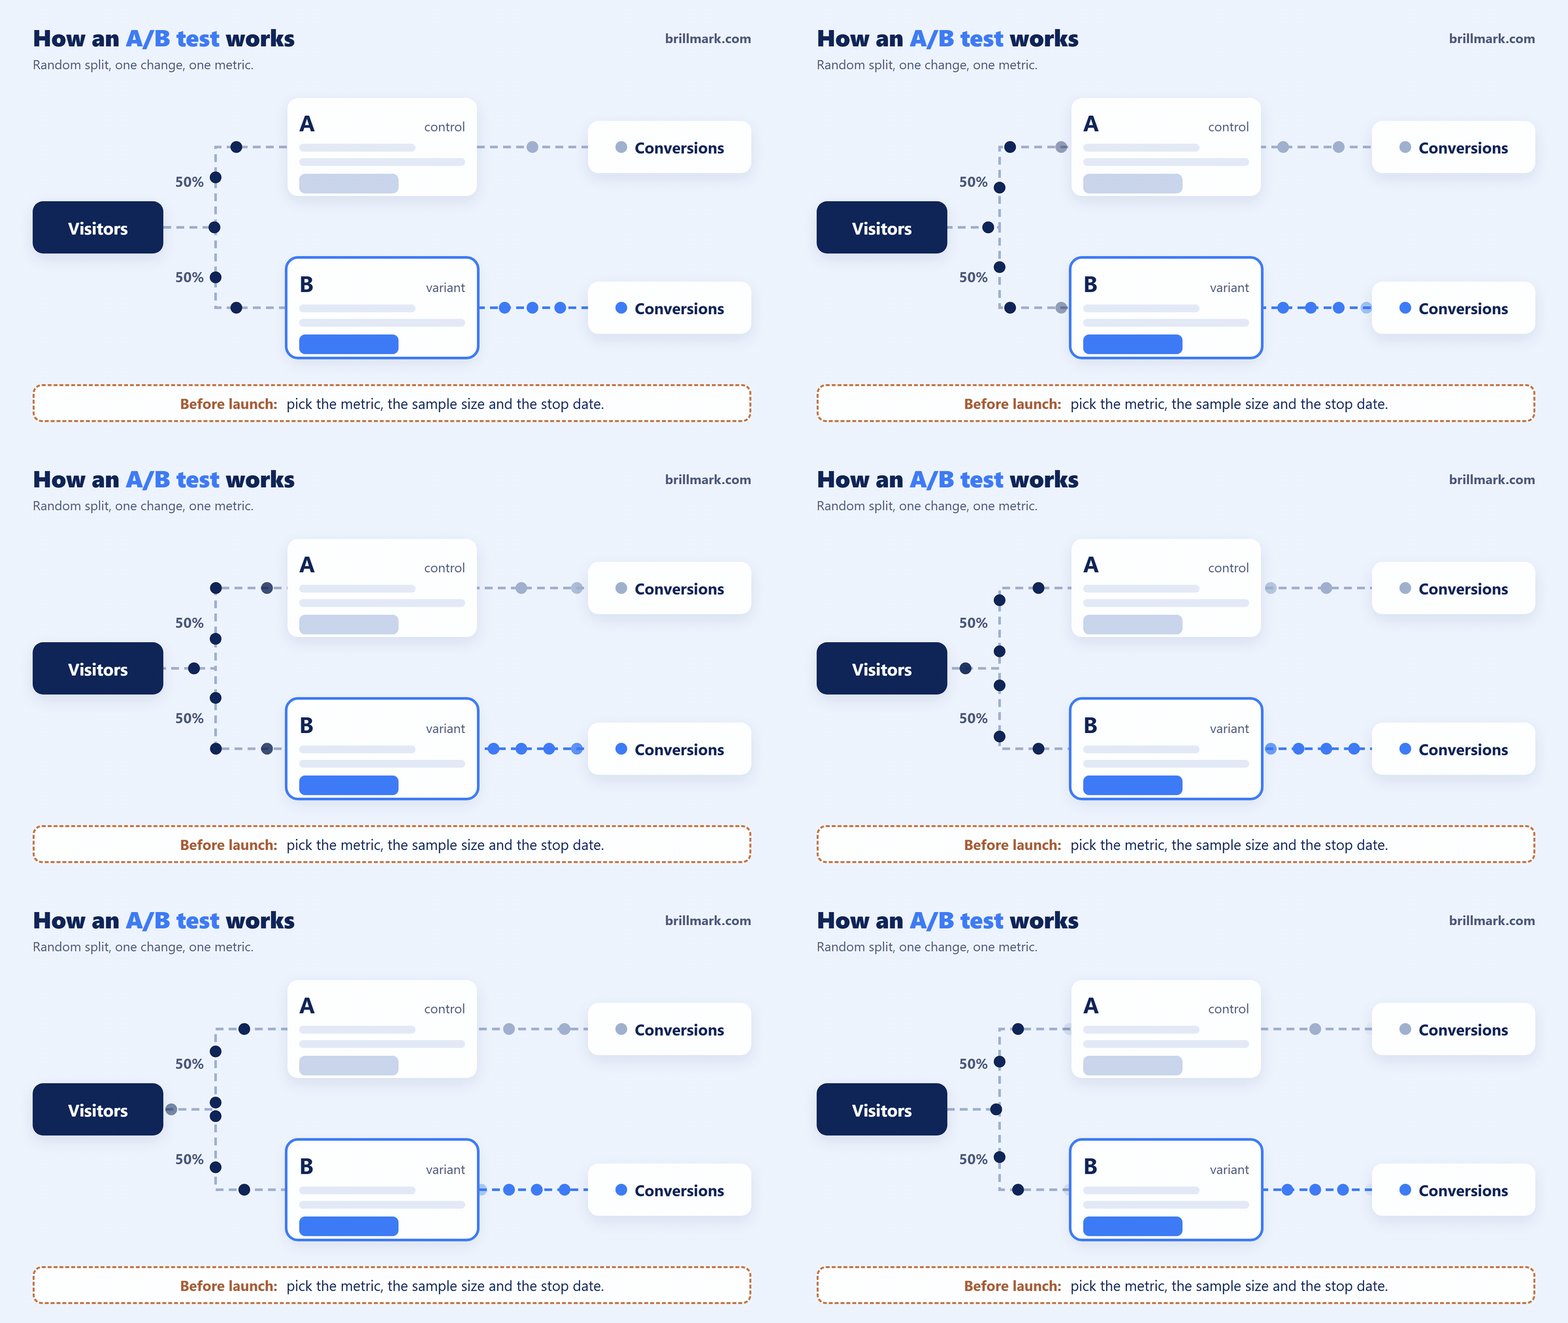
That last sentence carries most of the weight. Random split, one change, one metric decided in advance: drop any of the three and you have an opinion with a chart attached.
The anatomy: eight parts of every A/B test
Every A/B test has the same eight parts, whether it changes a button label or a whole checkout. Most of them are decisions you make before anyone writes code.
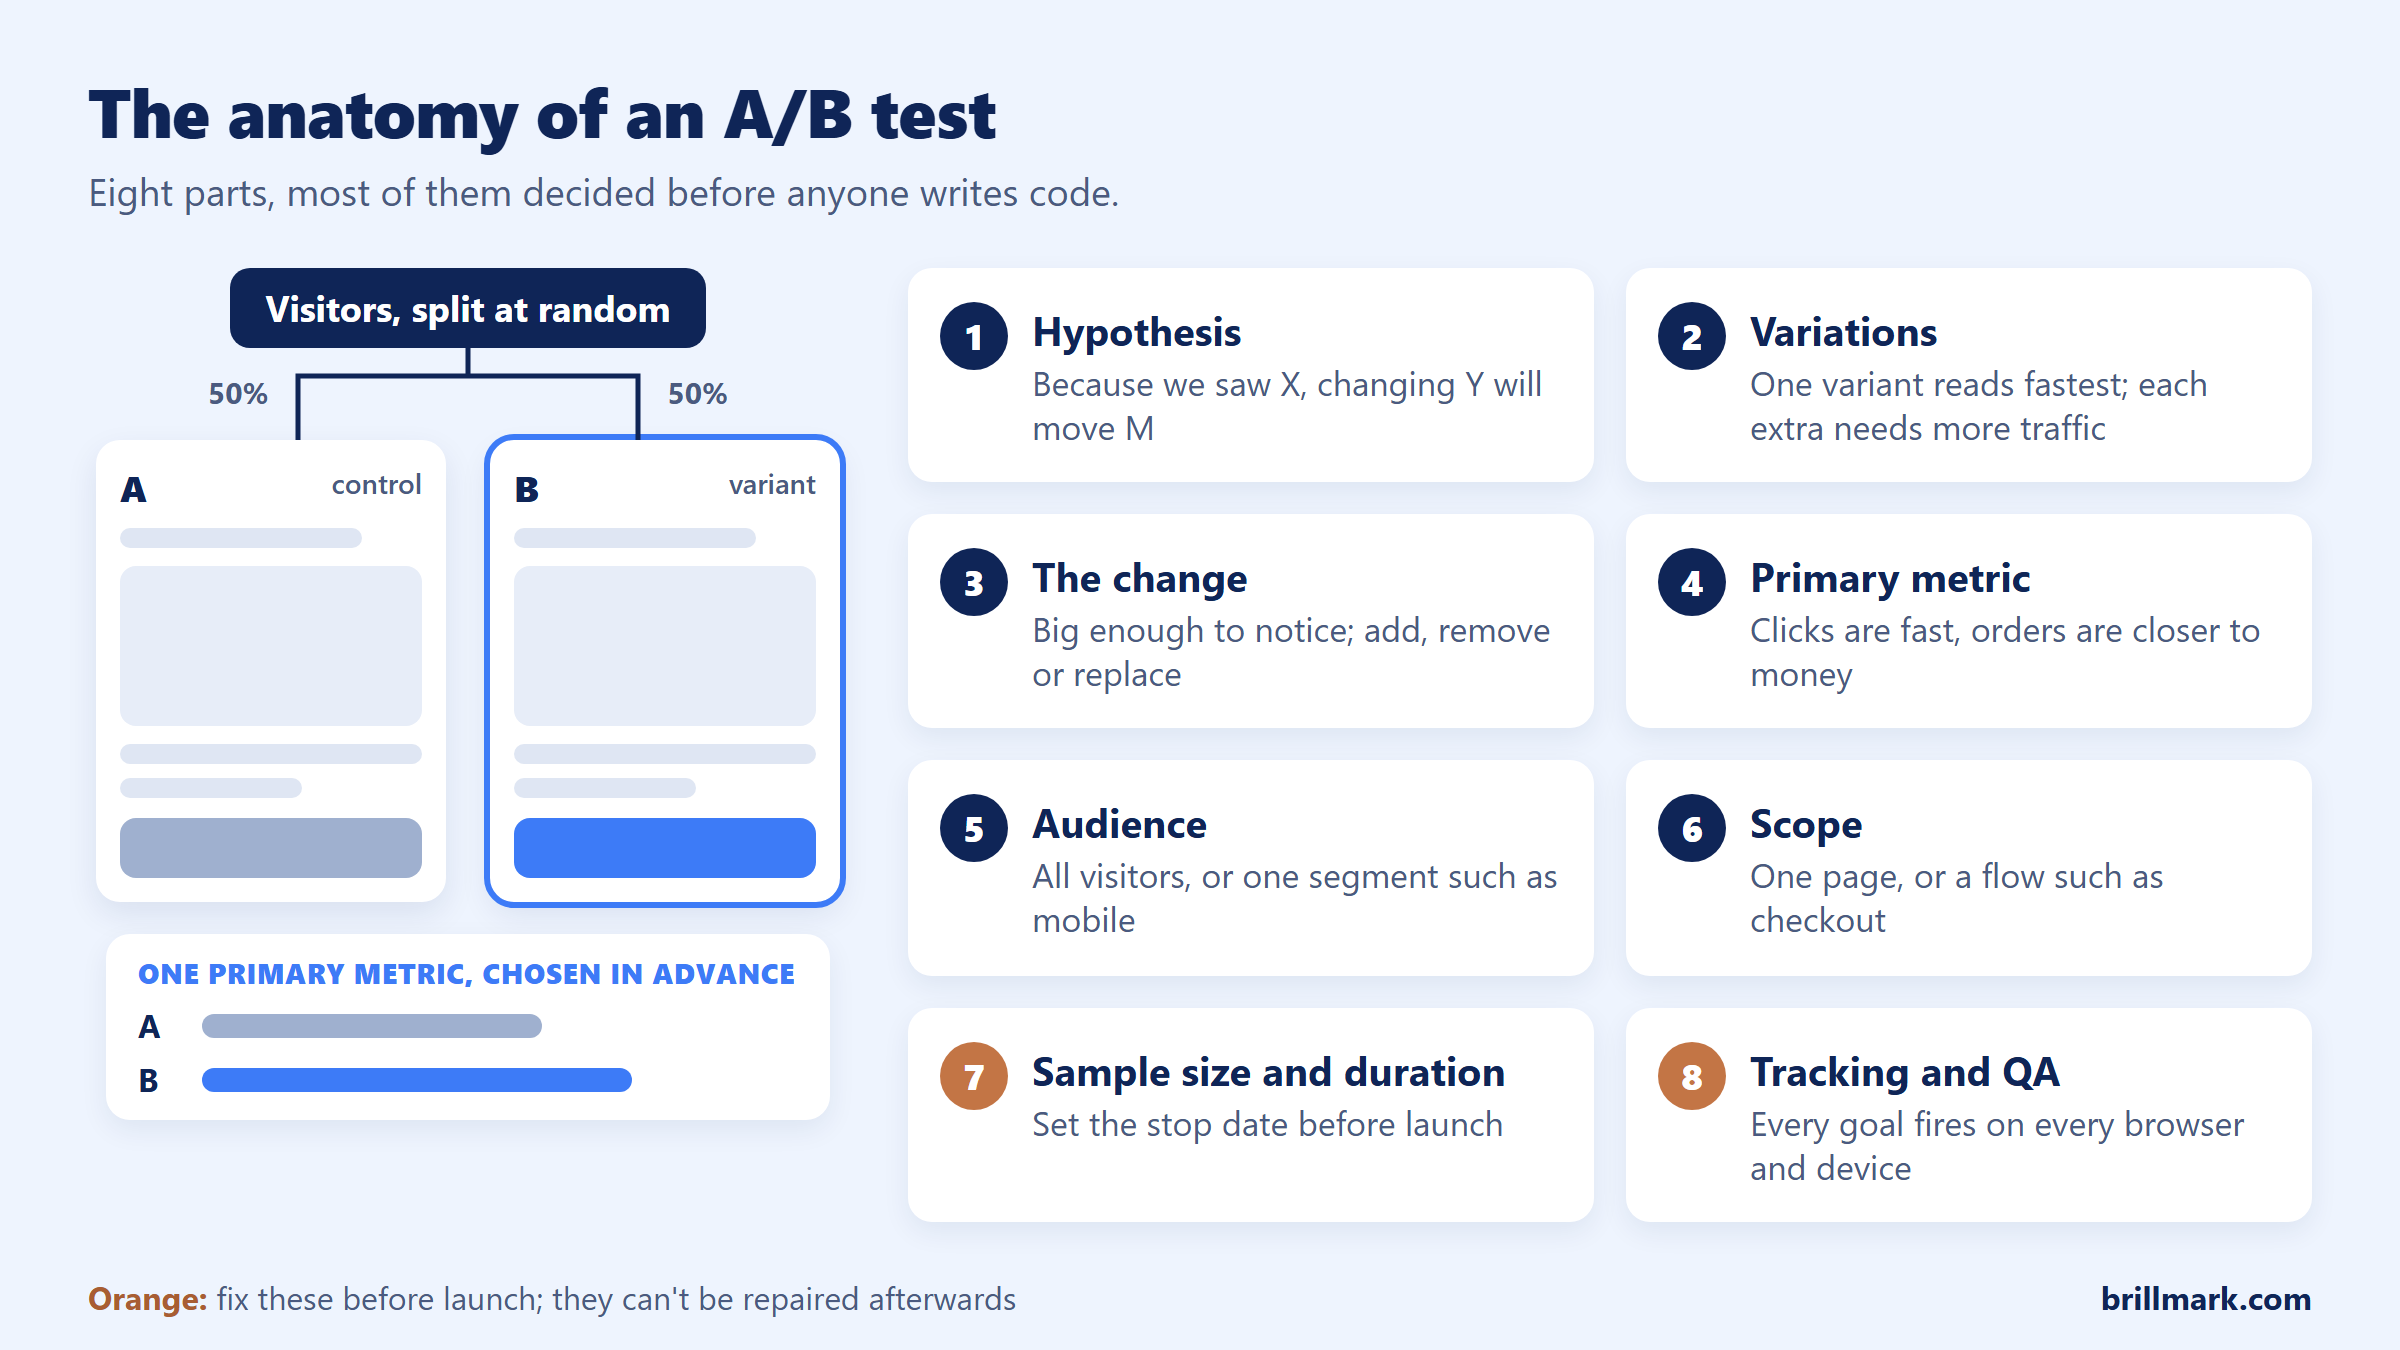
- Hypothesis. “Because we saw X, we believe changing Y for Z visitors will move metric M.” If you can’t fill in the X, you are guessing.
- Variations. One variant is the fastest to read. Each extra variant needs about as much traffic again.
- The change. Its size and its type. A change too small to notice usually can’t move a metric you can measure. Adding, removing and replacing an element carry different risks: replacing something can throw away what already worked.
- Primary metric. Clicks are fast to measure and loosely tied to money. Orders and revenue are slower and closer to what you care about. Pick one, plus one or two guardrail metrics you don’t want to hurt.
- Audience. All visitors, or one segment such as mobile, new or paid traffic. A narrower audience can make the change more relevant, at the cost of slower tests.
- Scope. One page, or a flow across several pages. Funnel tests answer bigger questions and take longer to build and check.
- Sample size and duration. How many visitors you need to detect the smallest lift worth having, and so how long to run. Decide it before launch.
- Tracking and QA. Goals that fire on every browser and device, and a variant that looks and works as designed. A test with broken tracking still produces numbers. They are just wrong.
Types of A/B test
The type of test follows from how big your change is and how much traffic you have. Six cover almost everything a growth team or agency runs.
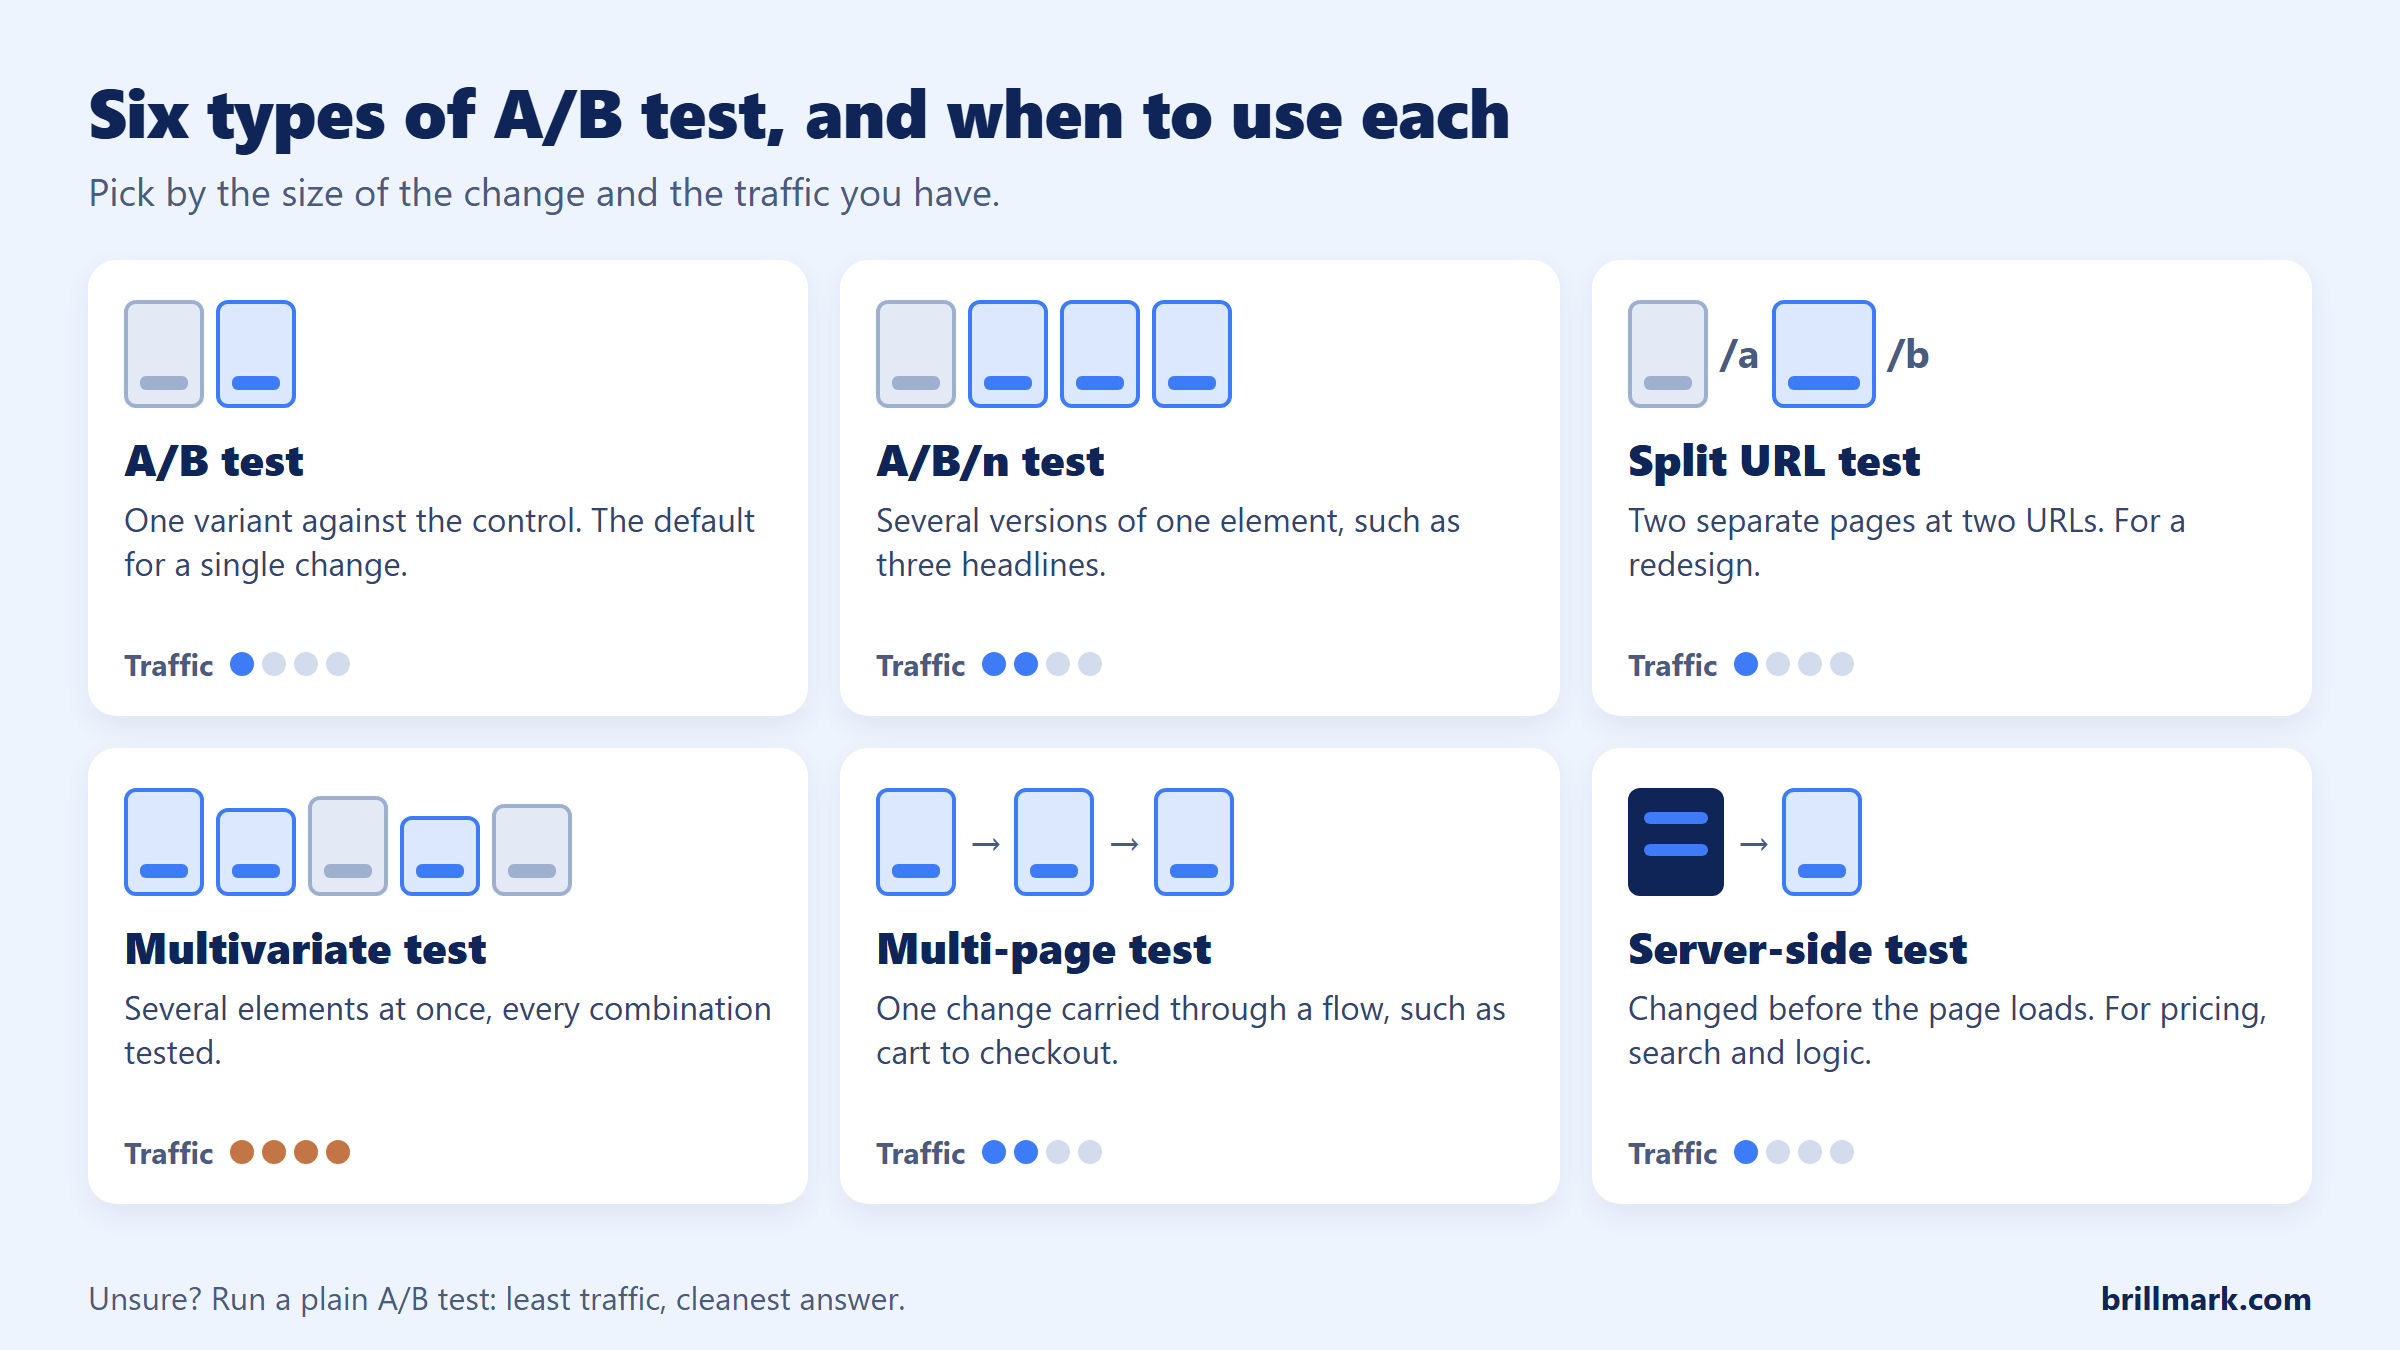
- A/B: one variant against the control. The default.
- A/B/n: several versions of the same element, such as three headlines. Each one splits your traffic further.
- Split URL: two separate pages at two URLs. Right for a redesign that is too different to build as an overlay.
- Multivariate (MVT): several elements at once, every combination tested. The Obama example below tested 4 buttons and 6 images or videos, which made 24 combinations.
- Multi-page (funnel): one change applied through a flow, such as a new shipping message on cart, checkout and confirmation.
- Client-side or server-side: client-side tests change the page in the browser and are quick to launch from a visual tool. Server-side tests change what the server sends, which suits pricing, search and anything involving logic, and needs your developers.
If you are unsure, run a plain A/B test: it needs the least traffic and gives the cleanest answer.
How to set up your first A/B test
Setting up a sound A/B test takes eight steps, and the statistics only show up in one of them.
- Pick a page with traffic and a problem. Use analytics, recordings or support tickets to find where people drop off.
- Write the hypothesis in the format above.
- Choose one primary metric and one or two guardrails.
- Work out the sample size and decide the stop date. Use a sample size calculator with your current conversion rate and the smallest lift you would act on.
- Build the variant in your testing tool.
- QA it on real browsers and devices, and check every goal fires.
- Launch, and don’t stop early. Checking the result every day and stopping the moment it looks good is a common way to get a false winner.
- Read it out against the metric you picked in step 3, and write down what you learned, even when the answer is no.
Step 4 is the one that surprises people. The smaller the lift you want to detect, the more visitors you need, and the number grows fast.
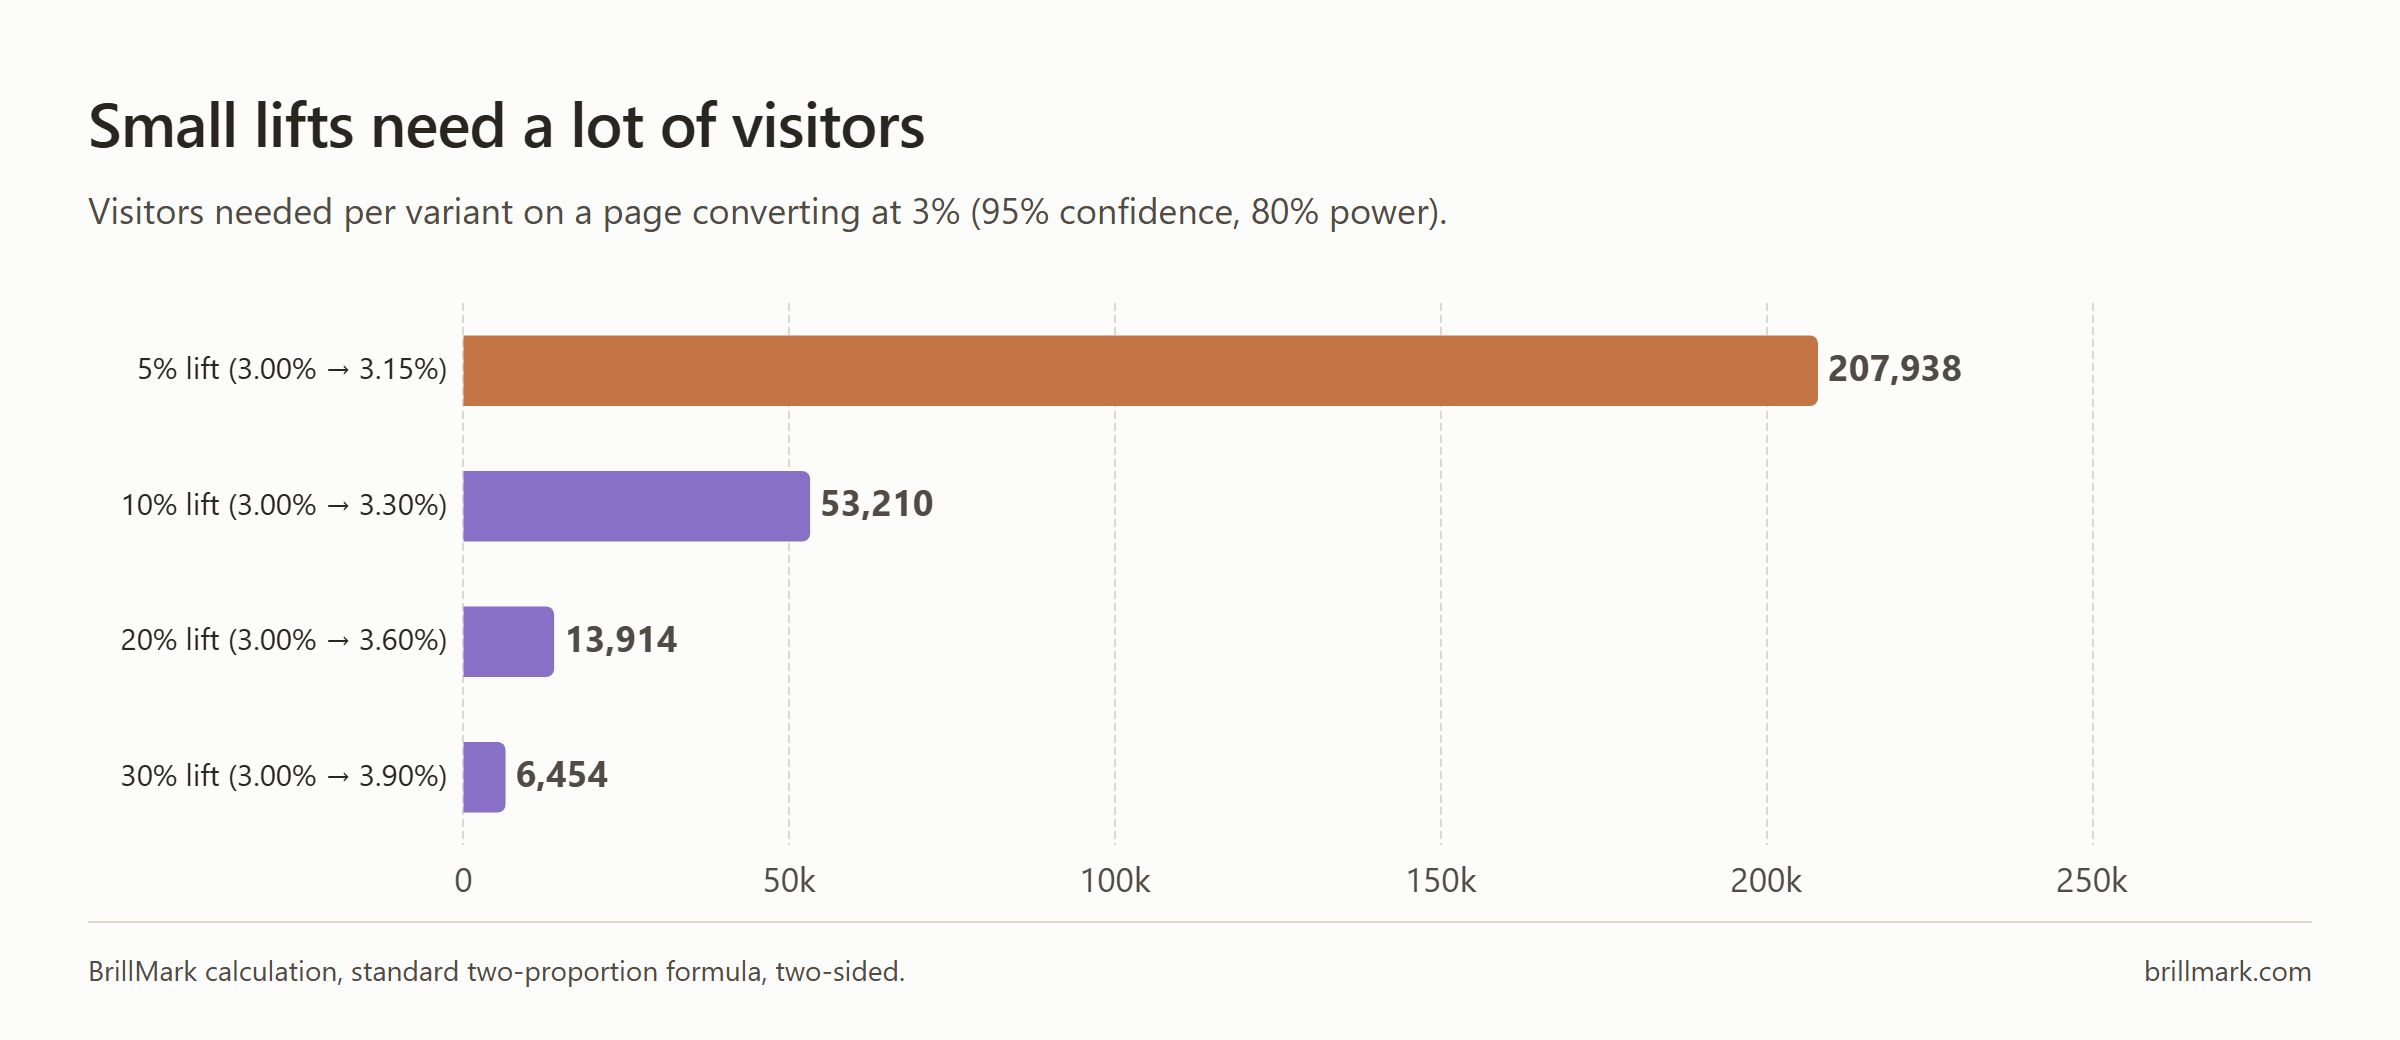
We calculated these with the standard two-proportion formula (95% confidence, 80% power), the same one most online calculators use. On a page converting at 3%, spotting a 10% lift (3.0% to 3.3%) takes about 53,000 visitors per variant. A 5% lift takes about 208,000. If your page can’t reach the sample size in four to six weeks, test a bigger change or a busier page.
Our process at BrillMark
At BrillMark we build, QA and launch tests for growth teams and CRO agencies, and every test goes through the same seven steps.
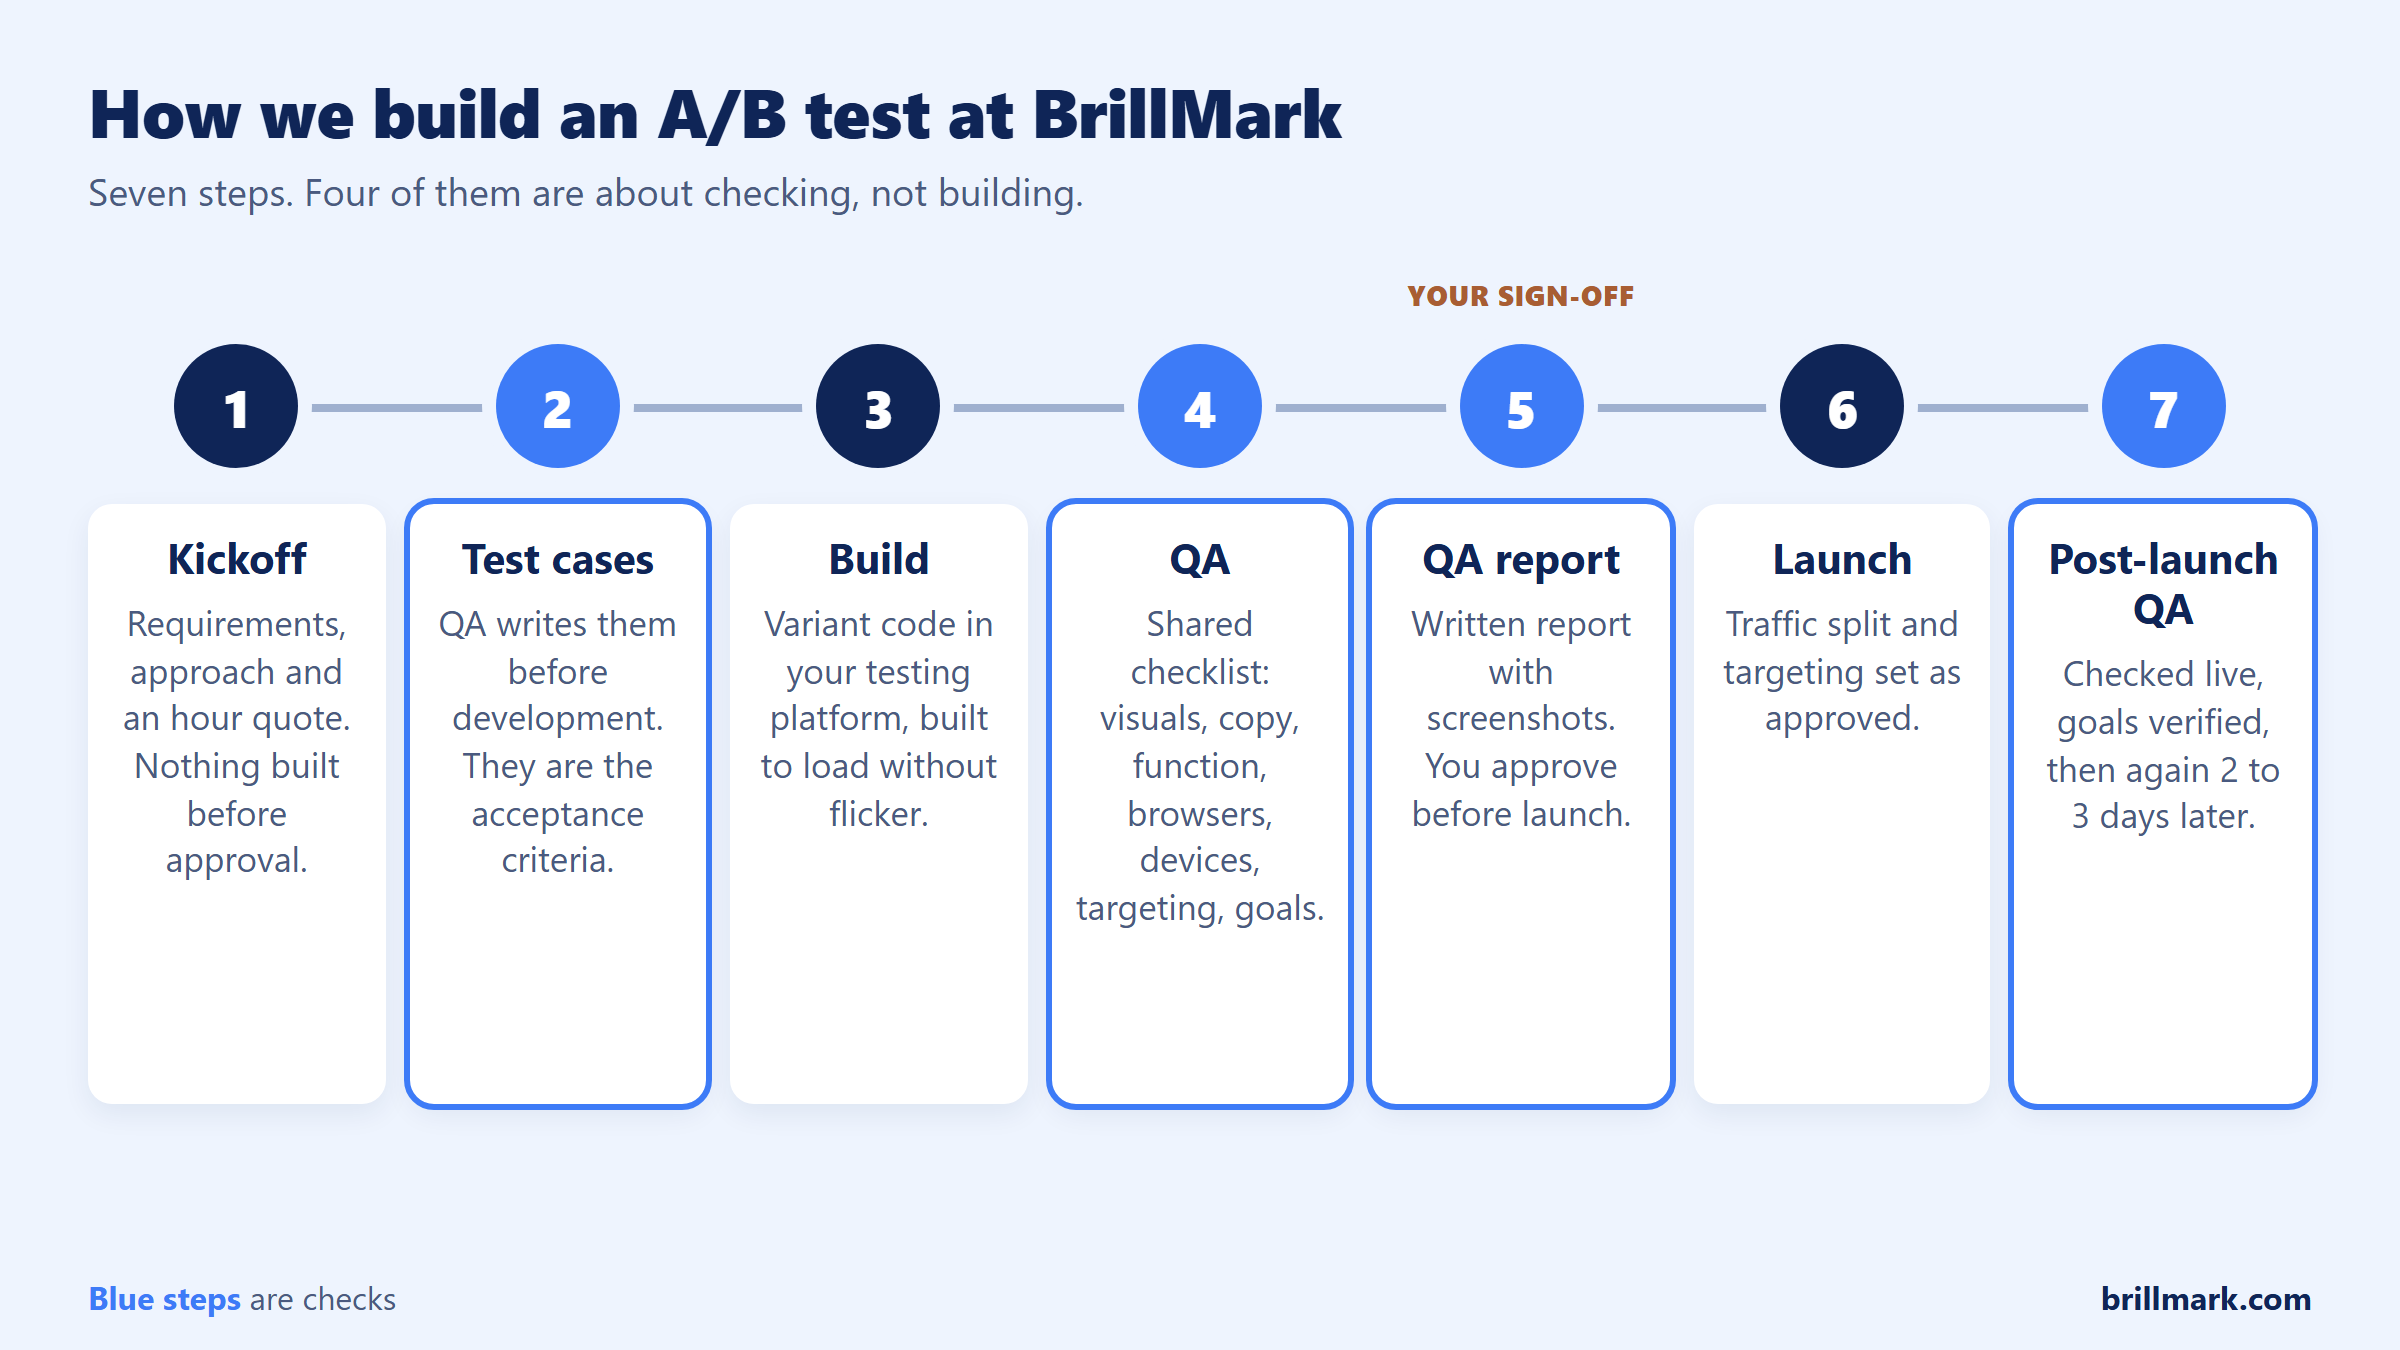
The test cases come first. QA writes them before development starts, and they act as the acceptance criteria. The checklist covers styling, copy, functionality (including flicker on page load), Chrome, Firefox, Safari and Edge on mobile and desktop, targeting and traffic split, and every goal. After launch we check the test again in the live environment and once more two to three days later.
In our experience a test is far more likely to go wrong in its tracking or its QA than in its idea, so that is where we spend the time.
A/B testing tools
Most A/B testing tools fall into two groups: visual tools that marketers can drive, and feature-flag tools that developers run inside the product.
- Visual and client-side: VWO, Optimizely Web, AB Tasty, Convert, Kameleoon, Adobe Target. Good for marketing pages, landing pages and ecommerce.
- Feature-flag and server-side: Optimizely Feature Experimentation, GrowthBook, Statsig, LaunchDarkly. Good for product changes, pricing and logic.
- Platform-native: Shopify has its own testing apps, with limits on what can change in checkout.
Google Optimize, the free option many teams started with, shut down on September 30, 2023. If an old guide tells you to start there, the guide is out of date.
Choose by three questions. Who will build the variants? Do your tests change the page or the logic behind it? Does the tool send results to the analytics you already trust? The best tool is the one your team can build, QA and read a test in every week.
A/B test examples worth knowing
Each of these four is documented at the source, and each teaches something different.
- Obama campaign sign-up page, 2007. The team tested 4 button labels and 6 images or videos, 24 combinations, on 310,382 visitors. The original converted at 8.26%. The winner (“Learn More” with a family photo) converted at 11.6%, a 40.6% lift. Every video lost to every image, including the one the staff liked best. Dan Siroker, who ran it, estimated the extra sign-ups were worth about $60 million in donations, assuming the lift held all campaign.
- Bing title colours. Slightly different shades of blue, green and black in search results. The result looked too good, so Bing re-ran it on 32 million users. Same answer: more than $10 million a year (HBR).
- Amazon credit card offer. Moving the offer from the home page to the shopping cart page boosted profits by tens of millions of dollars a year (same article).
- Bing ad size. Fewer but larger ads, in the same space, raised revenue by more than $50 million a year without hurting the main user experience metrics (same article).
None of these changes was large. What they had in common was a clean test and a big enough sample.
Case study: the Bing headline that sat in a backlog
The Bing headline test is worth studying for how close it came to never running.
The idea changed how ad headlines were displayed. Program managers ranked it low among hundreds of proposals, and it waited more than six months. An engineer ran it because it was cheap to build. Within hours the variant was making so much money that it set off a “too good to be true” alert, which at Bing usually meant a bug. It wasn’t. Revenue was up 12%, and key user experience metrics held.
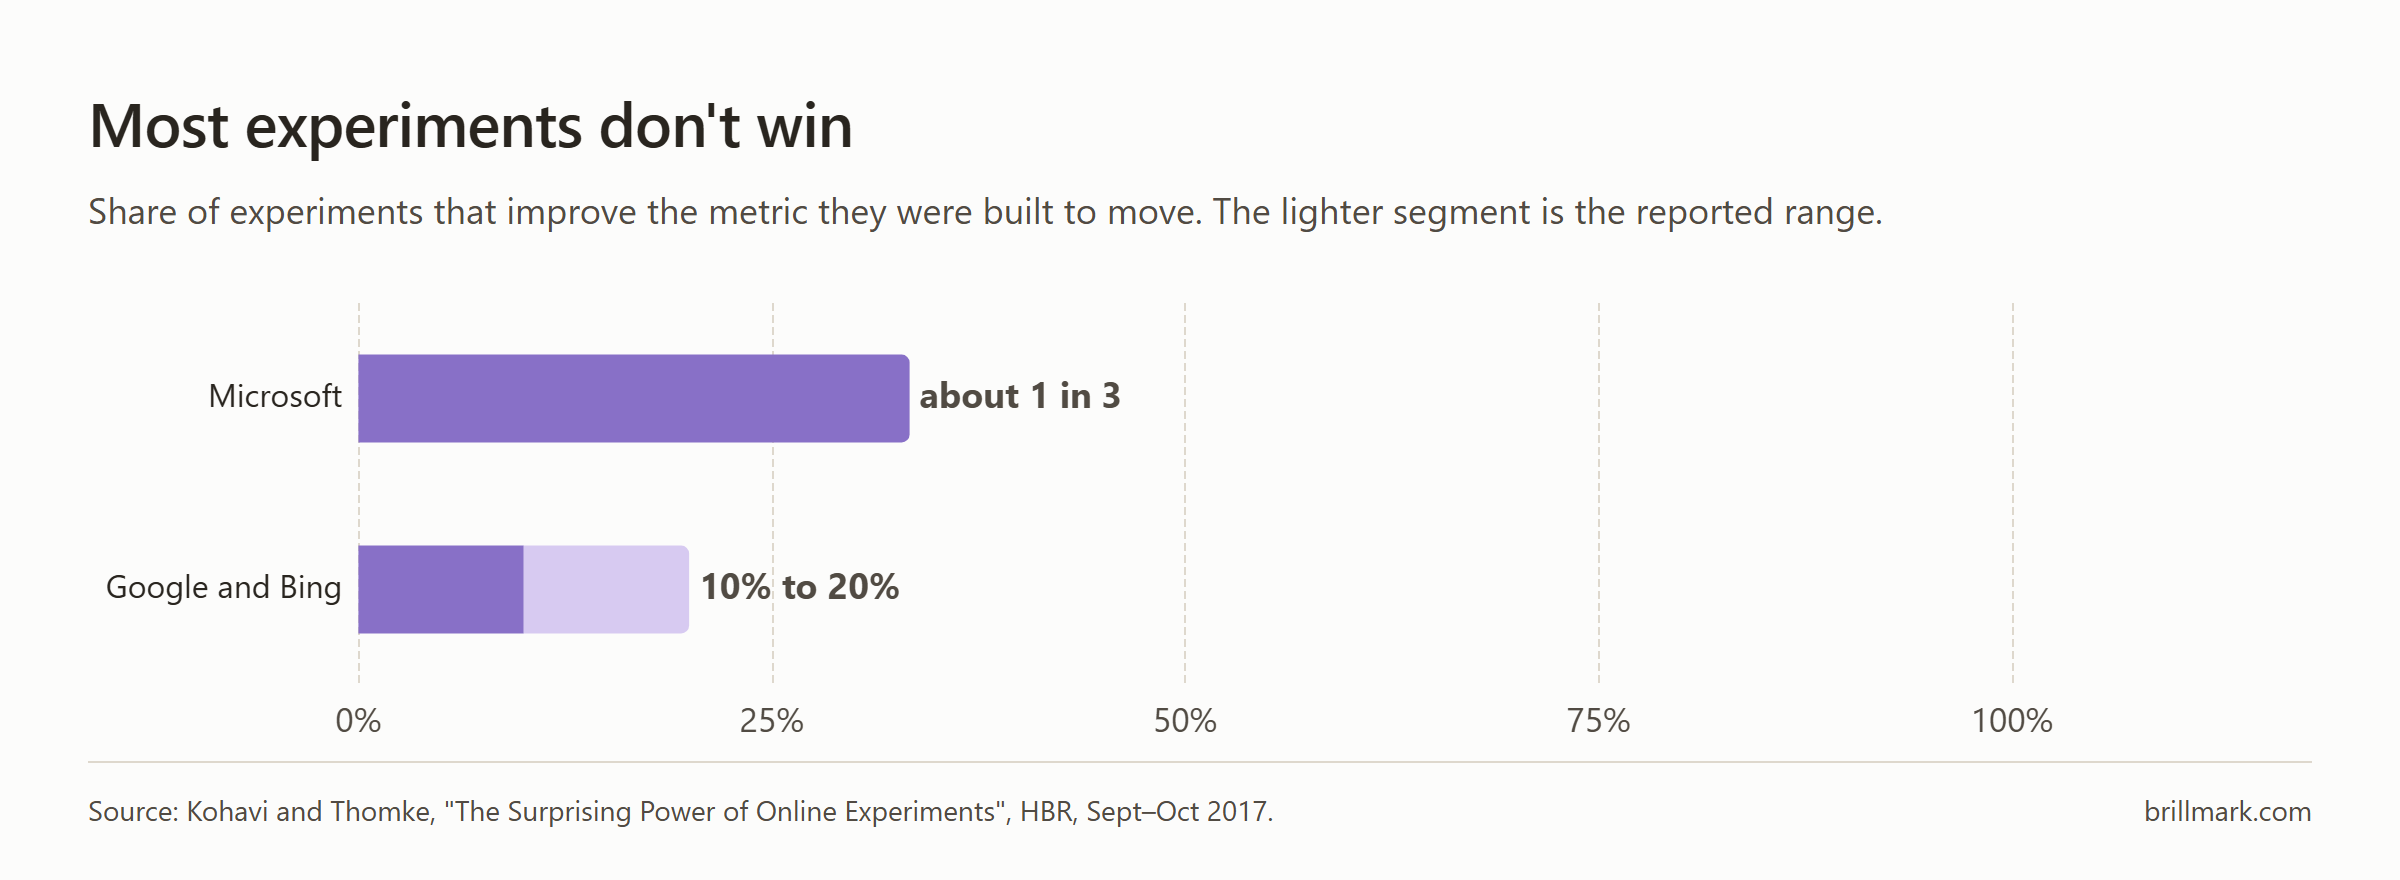
Three things to take from it. First, the people who rank ideas are often wrong, so a cheap test beats a long debate. Second, a result that looks too good should be checked like a bug before it is celebrated. Third, the guardrail metrics are what let Bing ship a revenue win without making search worse. With one experiment in three winning even at Microsoft, the teams that learn fastest are the ones that can run tests cheaply and trust every readout.
FAQ
How long should an A/B test run?
Until it reaches the sample size you calculated, and for at least one full week so every weekday is included. Two full business cycles is a safer default. Decide the end date before launch.
How much traffic do I need for A/B testing?
It depends on your conversion rate and the lift you want to detect. At a 3% conversion rate, detecting a 10% relative lift needs about 53,000 visitors per variant. Low-traffic sites should test bigger changes.
What is the difference between A/B and multivariate testing?
An A/B test compares whole versions. A multivariate test changes several elements at once and tests every combination, so it needs many times more traffic.
Can I stop an A/B test early if it is winning?
Not with a standard fixed-sample test. Stopping when the result first looks good inflates false winners. Some tools use sequential statistics built for early stopping; check which method yours uses.
Does A/B testing hurt SEO?
Not if it is set up properly. Google’s guidance is to show Googlebot the same pages people see, point split URL variants at the original with rel="canonical", use 302 rather than 301 redirects, and remove the test once you have your answer.
Have more test ideas than development time? BrillMark builds, QAs and launches A/B tests on the platform you already use, from copy swaps to multi-step funnel tests. Send us one hypothesis or design and get back an approach, hour estimate and QA plan, usually within one business day.
Make your website ready for the AI era.
AI is changing how people discover, evaluate, and interact with websites. We help you identify optimization opportunities across content, UX, technical performance, SEO, and conversion paths.