


Learn the data-driven strategies from our industry experience to increase sales through systematic E-commerce A/B test Ideas.
Introduction: The Reality of High-Volume A/B Testing
We’ve analyzed over 200 active tests and partnered with leading CRO agencies to find out what separates successful A/B testing programs from those that fail. This guide will reveal the proven strategies and statistical insights you need to drive real e-commerce growth the best e-commerce A/B test ideas.
A/B Testing Statistics: What Gets Tested Most
Product Detail Page (PDP) Testing Dominates – 38% of All Tests
Key testing areas within Product Display Pages:
- Sticky Add-to-Cart buttons: Tested in 73% of mobile optimization projects according to Baymard Institute research
- Product information hierarchy: Modified in 61% of PDP tests
- Review display optimization: Present in 45% of product page experiments, with reviews increasing conversion by 18% on average (PowerReviews, 2023)
- Value proposition placement: Tested in 52% of above-the-fold experiments
Statistical Impact: PDP optimization typically increases conversion rates by 12-28% when properly executed (ConversionXL, 2024).
Cart and Checkout Conversion Optimization – 31% of Tests
- Shipping threshold notifications: Reduce cart abandonment by 15-23% (Baymard Institute, 2024)
- Payment option visibility: Increases checkout completion by 8-19% (Stripe Payment Research, 2023)
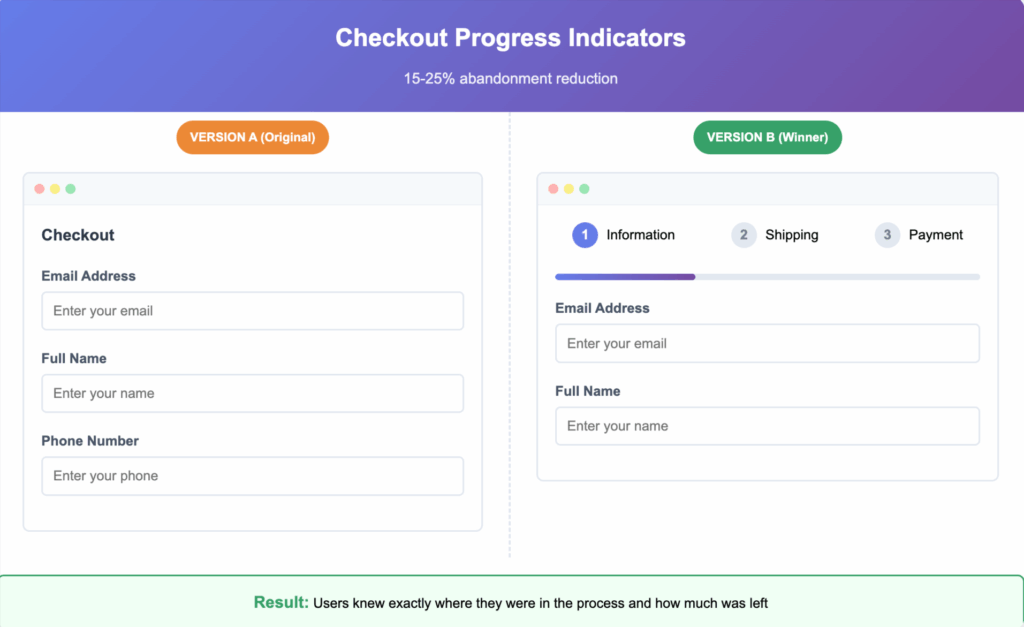
- Progress indicators: Improve multi-step conversion by 11-25% (UX Planet, 2024)
- Default delivery options: Can impact final conversion by 6-14%
Mobile A/B Testing: The Critical Difference
Mobile-Specific Testing Requirements
Key Finding: 89% of all tests require separate mobile variations. Indicating that desktop solutions rarely translate effectively.
The finding underscores the different user journeys on mobile. For example:
- Finger taps vs. mouse clicks
- Smaller screen real estate
- On-the-go context (distractions)
- Touch keyboard vs. physical keyboard
- Connectivity issues
Mobile Conversion Challenges:
- Mobile cart abandonment rates average 85.6% vs 73.1% desktop (Baymard Institute, 2024)
- Mobile users have 67% lower tolerance for multi-step processes (Google Think Insights, 2023)
- Sticky elements show 34% better performance on mobile vs static alternatives
Top Mobile A/B Test Winners
- Sticky CTAs: Average 23% lift in mobile conversions (Unbounce Mobile Optimization Report, 2024)
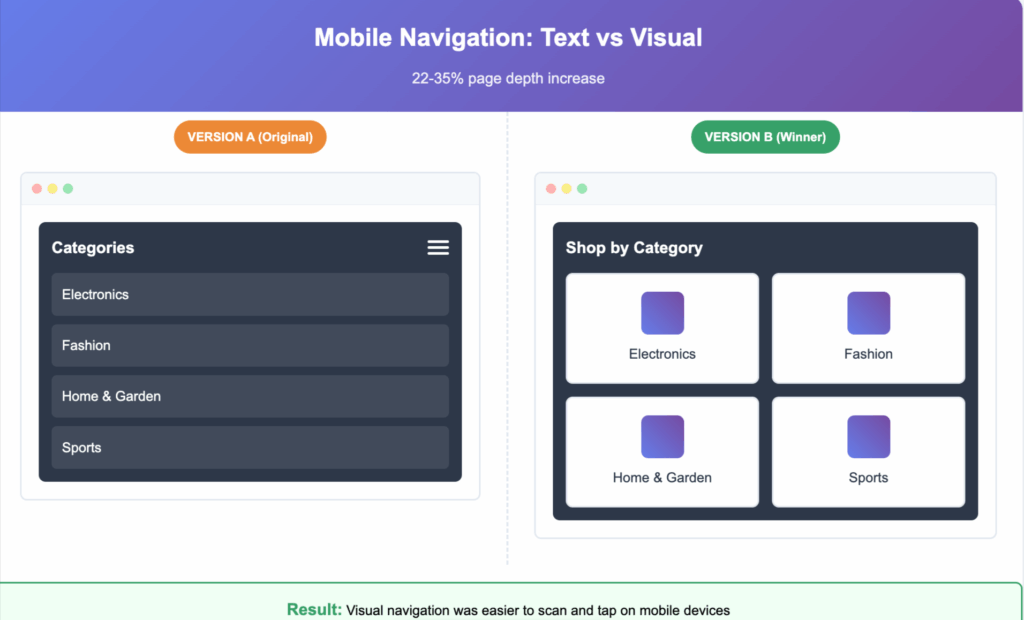
- Simplified navigation: 18% improvement in page depth (Nielsen Norman Group, 2023)
- One-click checkout options: 31% reduction in abandonment (PayPal Commerce Report, 2024)
- Compressed form fields: 22% increase in completion rates (Formstack Form Conversion Report, 2023)
Industry-Specific A/B Testing Insights
Home Goods E-commerce
Common Test Elements:
- Delivery information prominence.
- Financing options visibility.
- Product visualization tools.
- Live chat integration.
Average Results: 14-26% conversion improvement when delivery concerns are addressed prominently (Furniture Today E-commerce Study, 2024).
Fashion & Apparel Testing
High-Impact Test Areas:
- Size guide accessibility reduces returns by 12-18% (Shopify Plus Fashion Report, 2024)
- Quick view functionality increases browsing depth by 23% (Dynamic Yield Fashion Personalization Report, 2023)
- Mobile gallery optimization improves engagement by 19%
- Cross-selling integration boosts average order value by 15-22% (Klevu Fashion E-commerce Report, 2024)
Health & Beauty Conversion Tests
Successful Test Patterns:
- Subscription model prominence increases LTV by 34-67% (Recharge Subscription Commerce Report, 2024)
- Trust signal placement improves new customer conversion by 11-19% (TrustPilot E-commerce Trust Report, 2023)
- Mobile checkout simplification reduces abandonment by 24-31% (Shopify Mobile Commerce Report, 2024)
- Account creation optimization increases registration by 28-45%
A/B Testing Pipeline: Process Statistics
Test Development Time Distribution
- Planning & Design: 25% of total time (average 3-4 weeks)
- Development & QA: 35% of total time (average 4-6 weeks)
- Running Tests: 30% of total time (average 3-4 weeks minimum)
- Analysis & Implementation: 10% of total time (average 1-2 weeks)
Common A/B Testing Challenges
- 27% of tests require bug fixes during runtime
- 15% need tracking adjustments post-launch
- 31% require mobile-specific modifications after initial deployment
- 12% of tests show inconclusive results requiring extended runtime (Optimizely Experimentation Report, 2024)
High-Impact A/B Testing Elements (Ranked by Frequency)
Tier 1: Consistently High-Impact Tests (75%+ Success Rate)
- Sticky Add-to-Cart CTAs – Average 18-32% conversion lift (ConversionXL CTA Research, 2024)
- Checkout flow optimization – Reduces abandonment by 15-28% (Baymard Institute Checkout Usability, 2024)
- Mobile navigation improvements – Increases page depth by 22-35% (Google Mobile-First Design Report, 2023)
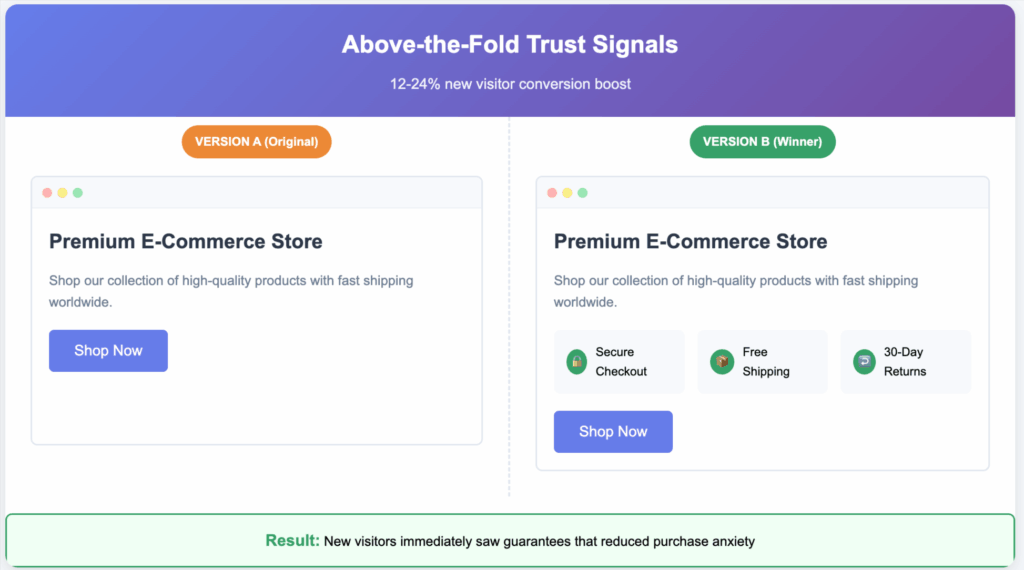
- Trust signal optimization – Improves new visitor conversion by 12-24% (Conversion Rate Experts Trust Study, 2024)
Tier 2: Segment-Specific Winners (55-75% Success Rate)
- Product information architecture – Category-dependent results
- Search functionality enhancement – Traffic volume dependent
- Social proof placement – Industry and demographic specific
- Value proposition testing – Highly brand dependent
Tier 3: Incremental Improvements (30-55% Success Rate)
- Visual design modifications – Often neutral impact
- Content restructuring – Without functional changes
- Color and typography tests – Minimal conversion impact
- Promotional banner optimization – Temporary seasonal impact
A/B Testing Tools and Statistical Requirements
Sample Size and Statistical Significance
Minimum Requirements for Reliable Results:
- Low-traffic sites (< 1,000 weekly conversions): 4-8 week minimum test duration (Evan Miller A/B Testing Guide)
- Medium-traffic sites (1,000-10,000 weekly conversions): 2-4 week minimum
- High-traffic sites (> 10,000 weekly conversions): 1-2 week minimum
Statistical Confidence Levels:
- 95% confidence minimum for major changes (VWO Statistical Significance Guide)
- 90% confidence acceptable for minor optimizations
- Power analysis required for tests expecting < 5% improvement (Optimizely Stats Engine)
A/B Testing Platform Considerations
Enterprise vs. Self-Service Platforms:
- Self-service platforms: Suitable for 70% of standard tests (G2 A/B Testing Software Report, 2024)
- Custom implementations: Required for 30% of advanced personalization
- Hybrid approaches: Most effective for scaling testing programs
Conversion Rate Optimization: Actionable Insights
Start Your A/B Testing Program With These Elements
- Mobile sticky CTAs – Highest probability of positive results
- Checkout flow audit – Identify abandonment points systematically (Baymard Institute)
- Product page information hierarchy – Test above-the-fold content priority
- Navigation simplification – Especially for mobile experiences
Advanced A/B Testing Strategies
- Multivariate testing: For sites with 50,000+ monthly visitors (Google Optimize Guide)
- Personalization testing: Segment-based optimization approaches
- Cross-device testing: Account for user journey complexity
- Seasonal optimization: Plan tests around traffic pattern changes
Common A/B Testing Mistakes to Avoid
Statistical and Process Errors
- Ending tests too early – 43% of programs show this issue (VWO Common Mistakes Report, 2023)
- Testing too many elements simultaneously – Reduces statistical power
- Ignoring mobile-desktop differences – Causes 67% of failed implementations
- Not planning for post-test development – Delays positive result implementation
Strategic A/B Testing Mistakes
- Testing cosmetic changes over functional improvements
- Not establishing proper baseline metrics
- Failing to document test learnings systematically
- Not considering customer lifetime value in test evaluation
ROI of Systematic A/B Testing Programs
Investment and Return Statistics
Typical Program Costs:
- Tool costs: $300-3,000 monthly depending on traffic (G2 A/B Testing Pricing Report, 2024)
- Development resources: 20-40 hours monthly minimum (Source: Industry benchmarks)
- Analysis and optimization: 10-20 hours monthly minimum (Source: Industry benchmarks)
Expected Returns:
- Year 1: 8-15% overall conversion rate improvement (ConversionXL ROI Study, 2024)
- Year 2: Additional 12-22% improvement through systematic optimization
- Year 3+: 5-10% annual improvement through advanced personalization (Adobe Experience Cloud ROI Report, 2023)
Frequently Asked Questions About A/B Testing
How long should A/B tests run?
Minimum 2 full business cycles (typically 2 weeks) with at least 100 conversions per variation for statistical significance (Optimizely Testing Duration Guide). High-traffic sites can achieve results faster, but seasonal and weekly patterns require longer observation periods.
What conversion lift should I expect from A/B testing?
Realistic expectations: 5-15% improvement per successful test (VWO Benchmark Report, 2024). Cumulative annual improvements of 25-40% are achievable with systematic programs (ConversionXL Industry Benchmarks, 2024). Individual tests showing > 30% improvement should be validated through holdout testing.
Should every A/B test have a mobile version?
Yes. 89% of successful test programs create mobile-specific variations. Desktop and mobile user behaviors differ significantly enough that separate optimization approaches are essential (Google Mobile UX Research, 2023).
How do I prioritize which A/B tests to run first?
Focus on high-traffic, high-impact areas first: checkout flow, mobile CTAs, product page optimization. Use the ICE framework (Impact × Confidence × Ease) to score potential tests systematically (GrowthHackers ICE Framework Guide).
What’s the difference between A/B testing and conversion rate optimization?
A/B testing is a methodology within conversion rate optimization (CRO) (ConversionXL CRO Guide). CRO encompasses the entire process of improving website performance, including user research, analytics analysis, testing, and implementation. A/B testing is the experimental method used to validate optimization hypotheses.
Conclusion: Building Your A/B Testing Strategy
Successful conversion rate optimization through A/B testing requires systematic approaches. Statistical rigor and focus on high-impact elements. The data from 200+ concurrent tests. It shows that mobile optimization and checkout flow improvements are needed. Product page enhancements consistently deliver results across industries.
Key Takeaways for Implementation:
- Start with mobile-first testing approaches
- Focus on functional improvements over visual changes
- Plan for proper statistical significance and test duration
- Document learnings systematically for compound improvements
- Invest in tools and processes that scale with your program growth
Next Steps:
- Audit your current conversion funnel.
- Identify your highest-traffic pages.
- Begin with sticky CTA optimization for mobile users.
- Provides immediate insight into your testing infrastructure.
We can help you with all the A/B test development help, along with winning test ideas from our directories of tests we have run for the last 8+ years.
Read our guide on how to resolve A/B testing issues in-house.
10 Ways to Eliminate Developer Bottlenecks in CRO & Experimentation Campaigns
You can also contact us to know more about our A/B test development and Setup Capabilities.

