
Most websites are collecting data. Very few are using it to make decisions. This GA4 guide for beginners changes that- covering what GA4 is, how to set it up, what to track, and how to turn your data into action.
What Is Google Analytics 4?
Google Analytics 4 is Google’s current web analytics platform. It replaced Universal Analytics in 2023 and measures how users interact with your website and apps. GA4 helps you answer the questions that drive business decisions: where traffic comes from, which pages convert, and where users drop off.
You can access it any time at analytics.google.com, and Google’s own Analytics Help Center is the authoritative reference whenever a setting changes.
How Is GA4 Different From Universal Analytics?
The fundamental difference is the data model. Universal Analytics organized everything around sessions. GA4 organizes everything around events– every interaction (pageview, scroll, click, form submission) is its own event.
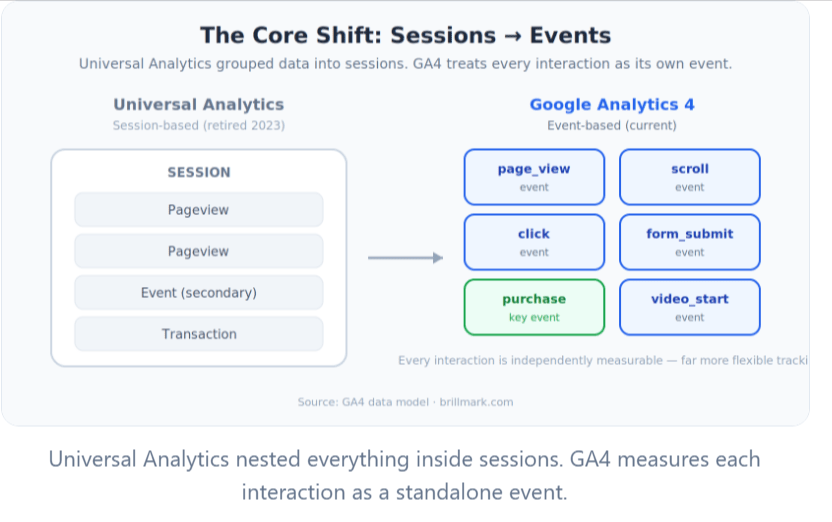
This shift gives you far more flexibility in what you track. It also means GA4 comes with built-in cross-device tracking, predictive metrics, and privacy tools like Consent Mode – none of which existed in the older platform.
The other key change: Bounce Rate is gone. GA4 replaced it with Engagement Rate– the percentage of sessions where a user spent 10+ seconds on your site, viewed 2+ pages, or triggered a conversion. It’s a more meaningful signal of content quality.
How to Set Up Google Analytics 4
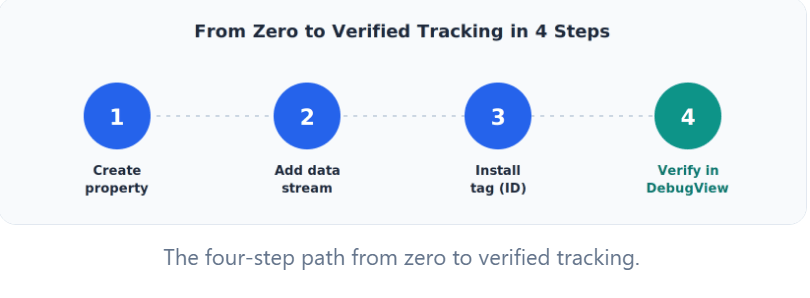
- Go to analytics.google.com and create an account and a GA4 property
- Add a Web Data Stream for your site and enable Enhanced Measurement: this automatically tracks scrolls, outbound clicks, file downloads, and video engagement with no extra code
- Install your Measurement ID (G-XXXXXXXXXX) via Google Tag Manager (recommended) or directly in your site’s <head>
- Verify setup using DebugView (Admin → DebugView)- confirm page_view and session_start events are firing
One setting to change immediately: go to Admin → Data Settings → Data Retention and switch from 2 months to 14 months. You’ll thank yourself later.
For the official, always-current walkthrough, see Google’s guide to setting up Analytics for a website or app and adding a GA4 property.
What Are Events and Conversions in GA4?
Events are the raw data- every user interaction GA4 records. Some fire automatically (page_view, session_start). Enhanced Measurement adds scroll, click, and download tracking. You can create custom events for anything else: button clicks, form interactions, CTA engagement.
Conversions (called key events in GA4) are the events that matter most to your business. Mark any event as a key event under Admin → Events. For lead generation businesses, this is typically a form submission. For e-commerce, it’s the purchase event. Google explains the distinction in its guide to conversions vs. key events and how to report on key events.
Without at least one key event configured, GA4 is a traffic report. With conversions set up, it becomes a performance measurement tool.
Which Reports Should Beginners Check First?
Start with these five:
- Realtime: confirms your tracking is working; useful during campaign launches
- Traffic Acquisition: where users come from; compare conversion rate by channel, not just volume
- Engagement: what users do on your site; engagement rate by page reveals content quality
- Landing Pages: which entry pages drive traffic and which drive conversions (these are often different)
- Conversions: total key event count and trends over time
How GA4 Reveals A/B Testing Opportunities
This is where GA4 becomes genuinely valuable for growth, and where most beginner guides stop short.
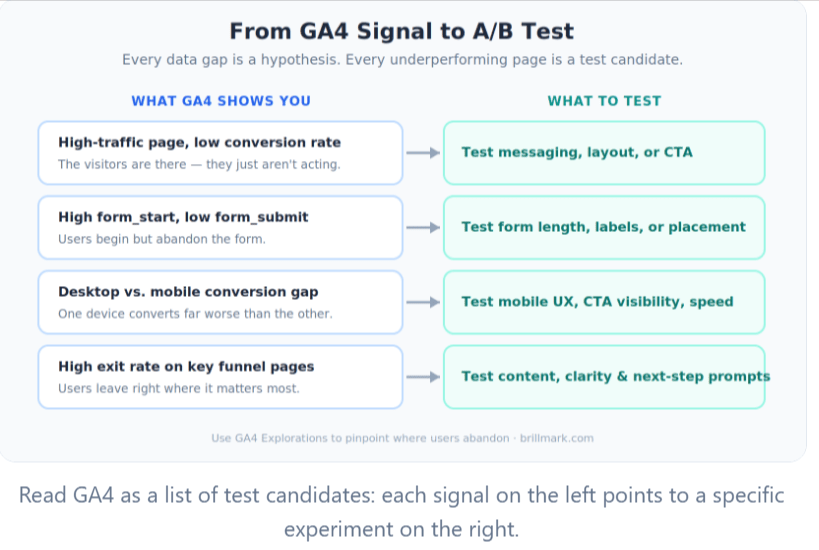
GA4 doesn’t just report what happened. It shows you where your site is underperforming relative to its potential. Every data gap is a hypothesis; every underperforming page is a test candidate.
What to look for:
- High-traffic pages with low conversion rate → test messaging, layout, or CTA
- High form_start vs. low form_submit ratio → test form length, field labels, or placement
- Significant desktop vs. mobile conversion gap → test mobile UX, CTA visibility, or page speed
- High exit rate on key funnel pages → test page content, offer clarity, or next-step prompts
GA4’s Exploration tools (funnel exploration, path exploration) let you map the exact steps between landing and conversion – making it easier to pinpoint where users abandon and what to test first. Turning those findings into a structured testing program is exactly what a conversion rate optimization and A/B testing development workflow is built for. (Analytics Mania)
Common GA4 Mistakes to Avoid
- Not configuring conversions: the most common beginner oversight- do this in your first week
- Tracking everything: define your measurement plan first; unfocused tracking creates noise
- Ignoring device segmentation: mobile and desktop often behave differently; always compare
- Never verify events: use DebugView after every implementation change
- Looking only at traffic: volume without conversion context is a vanity metric
Your Weekly GA4 Review (40 Minutes)
| Step | Focus | Time |
| Review Acquisition | Which channels drove sessions and conversions? | 10 min |
| Review Landing Pages | Where is the gap between traffic and conversion? | 10 min |
| Review Conversions | Is the conversion rate stable, improving, or declining? | 5 min |
| Identify Opportunities | Which pages or flows have the highest upside? | 10 min |
| Prioritize Experiments | What’s the highest-impact thing to test next? | 5 min |
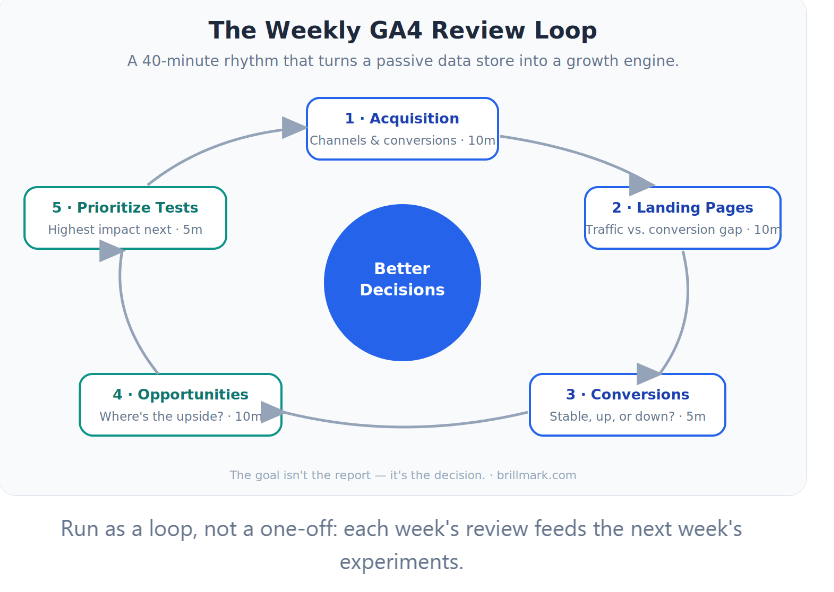
The goal isn’t the report; it’s the decision. A consistent weekly process turns GA4 from a passive data store into an active growth tool.
Conclusion: Data Is the Starting Point, Not the Finish Line
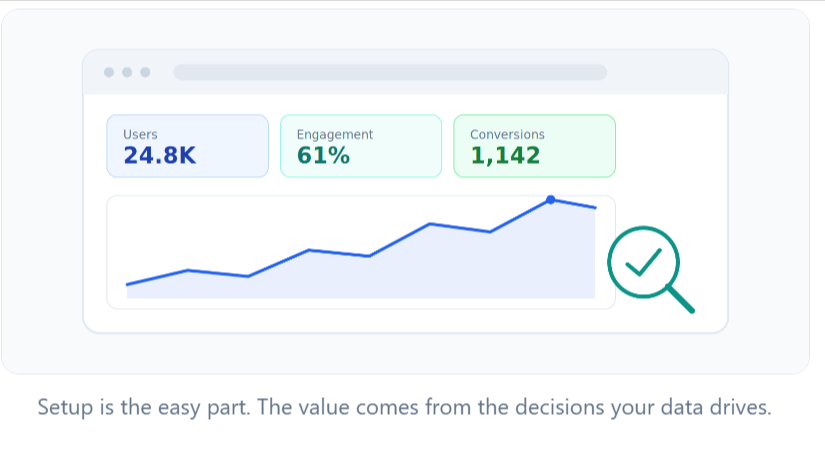
Here’s the truth about Google Analytics 4: the setup is the easy part. Creating a property, installing a tag, and enabling Enhanced Measurement can be done in an afternoon. What separates the businesses that grow from the ones that simply collect is everything that comes after.
Three habits make the difference:
- Track what matters: configure key events in your first week, so GA4 measures outcomes, not just visits.
- Review on a rhythm: a 40-minute weekly loop keeps you close to the gaps between traffic and conversion.
- Turn insight into experiments: Every underperforming page is a test waiting to happen.
Do those three things consistently, and GA4 stops being a dashboard you glance at and becomes the engine behind every growth decision you make. The reports will always tell you what happened. Your job – and the real return on analytics – is deciding what to do next.
Ready to Turn Your Google Analytics 4 Data Into Measurable Growth?
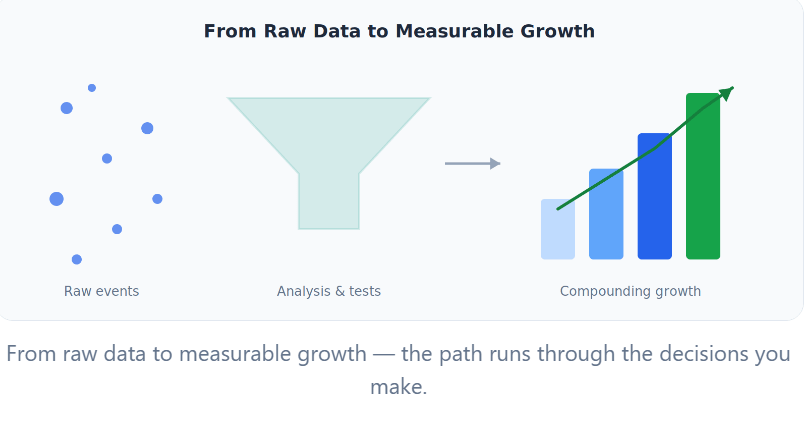
Setting up Google Analytics 4 is only the beginning. The real value comes from understanding your data, uncovering conversion opportunities, and turning insights into action.
Brillmark helps businesses move beyond basic reporting with analytics implementation, conversion rate optimization, A/B testing development, and full-service experimentation programs. Our team has supported 200+ agencies and global brands in using data to make better decisions and drive measurable growth.
Whether you need help improving your GA4 setup, identifying high-impact opportunities, or building a structured experimentation program, Brillmark can help.