






Most A/B testing mistakes happen after the experiment ends, not during it. Misreading results, trusting corrupted data, or declaring a winner too early are the errors that turn good experiments into bad decisions.
Where do you start?
What to review before reading A/B test results
Before looking at any metrics, confirm the experiment itself is trustworthy. Results from a broken or under-powered test are not meaningful.
- Test duration: the experiment ran for at least one full business cycle, typically two weeks minimum
- Sample size: enough traffic reached each variant to produce statistically reliable results
- Tracking health: conversion events fired correctly throughout the test with no gaps or anomalies
- QA validation: the variant was validated before launch, and no implementation issues were reported
Which numbers actually matter?
Which metrics matter most when evaluating an A/B test
Not every metric deserves equal weight. Focus first on the primary metric tied to your experiment hypothesis, then use secondary metrics to confirm the result makes sense.
- Conversion rate: the primary measure of whether the variant improved user behavior
- Revenue per visitor: accounts for order value differences that conversion rate alone misses
- Average order value: a variant can lower conversion rate but raise AOV, producing a net revenue gain
- Click-through rate: useful for CTA or navigation tests as a leading indicator
What does statistical significance mean?
What statistical significance actually means
Statistical significance tells you how likely a result is due to the change you made, not random variation. A 95% confidence level means there is a 5% chance the result is a false positive.
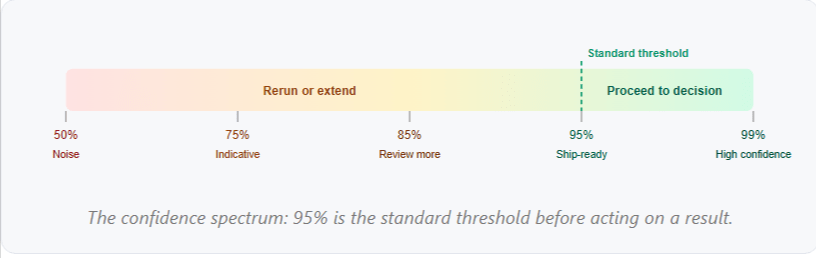
- Results below 95% confidence are not reliable enough to ship
- Confidence intervals show the range where the true effect likely sits
- P-values below 0.05 correspond to 95% confidence — the standard threshold
Is significance enough?
Why statistical significance is not enough to declare a winner
A result can be statistically significant and still not worth shipping. Business significance asks whether the lift is large enough to matter.
- A 0.2% lift on low traffic may not justify the cost to ship
- Revenue impact matters more than conversion rate when AOV varies between variants
- A significant result that worsens UX metrics may not be a real winner
Can bad tracking change the result?
How tracking errors lead to the wrong decision
Inaccurate analytics can invalidate an experiment without anyone noticing. A test that looks conclusive can be built entirely on corrupted data.
- Missing events: conversions that fail to fire make a winning variant appear neutral or negative
- Duplicate conversions: purchase events that fire multiple times inflate conversion rate and revenue figures
- Incorrect attribution: revenue credited to the wrong variant makes result comparison meaningless
Key rule
If GA4 revenue and platform revenue diverge significantly during an experiment, stop the test and investigate before drawing any conclusions.
How do you know if data is trustworthy?
How to validate that your experiment data is trustworthy
Run this checklist before interpreting any results.
Should you look at segments?
How to analyze audience segments
An overall winner can be a loser within your most valuable segment. Segment analysis separates surface-level results from actionable insight.
- New vs returning users: a variant that converts new visitors may reduce returning customer loyalty
- Mobile vs desktop: mobile and desktop users often respond very differently to the same change
- Traffic source: paid traffic and organic traffic frequently convert at different rates and for different reasons
When should you rerun instead of ship?
When to rerun an A/B test instead of shipping the winner
Not every completed experiment produces a result worth acting on. Knowing when to rerun protects you from costly shipping decisions.
- Sample size was too low to reach statistical significance before the test ended
- Primary and secondary metrics point in opposite directions with no clear explanation
- A tracking issue was found during or after the experiment
- The test ran during a sale, holiday, or other anomalous period
What mistakes should you avoid?
Most common mistakes when interpreting A/B test results
The errors that lead to bad decisions are almost always the same ones.
- Ending tests early: stopping when numbers look good is a leading cause of false positives
- Ignoring QA: shipping without confirming implementation quality creates compounding risk
- Chasing insignificant lifts: acting on a 0.1% lift below significance threshold wastes development resources
- Looking at one metric only: conversion rate without revenue context produces incomplete conclusions
What is the right decision framework?
A decision framework for every A/B test
Use this five-step process after every experiment before making a deployment decision.
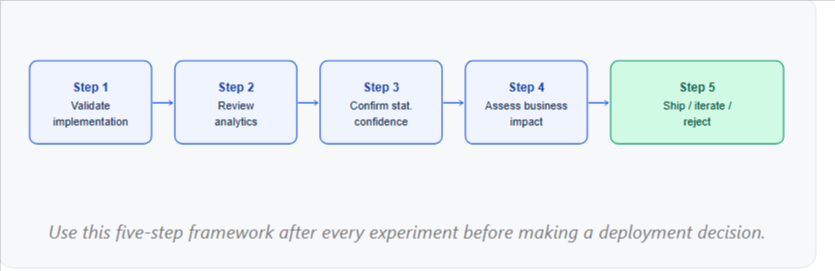
- Validate implementation: confirm QA was completed and no issues occurred
- Review analytics: verify events fired correctly, revenue matches, and no anomalies occurred
- Confirm statistical confidence: check that the result reached 95% confidence with adequate sample size
- Assess business impact: calculate annual revenue value of the lift before deciding
- Make the deployment decision: ship the winner, iterate the variant, or mark the test inconclusive and rerun
Ready to turn your A/B test results into measurable growth?
Running an A/B test is only the beginning. The real value comes from interpreting your results correctly, validating your data, uncovering meaningful conversion opportunities, and turning experiment insights into confident business decisions.
Brillmark helps businesses move beyond basic reporting with analytics implementation, conversion optimization, A/B testing development, and full-service experimentation programs. Our team has supported 200+ agencies and global brands in using data to make better decisions and drive measurable growth.
Whether you need help validating experiment data, improving your analytics setup, identifying high-impact optimization opportunities, or building a structured experimentation program, Brillmark can help.